







Universal Signal Backtester
Introduction
Every trader who has ever drawn an arrow on a chart has asked the same two questions right after it: where do I take profit, and where do I get out? Most of us answer with a habit — “two ATR”, “always 1:2”, “wherever the last swing was” — and never check whether that habit was ever the right one for the instrument we are actually trading.
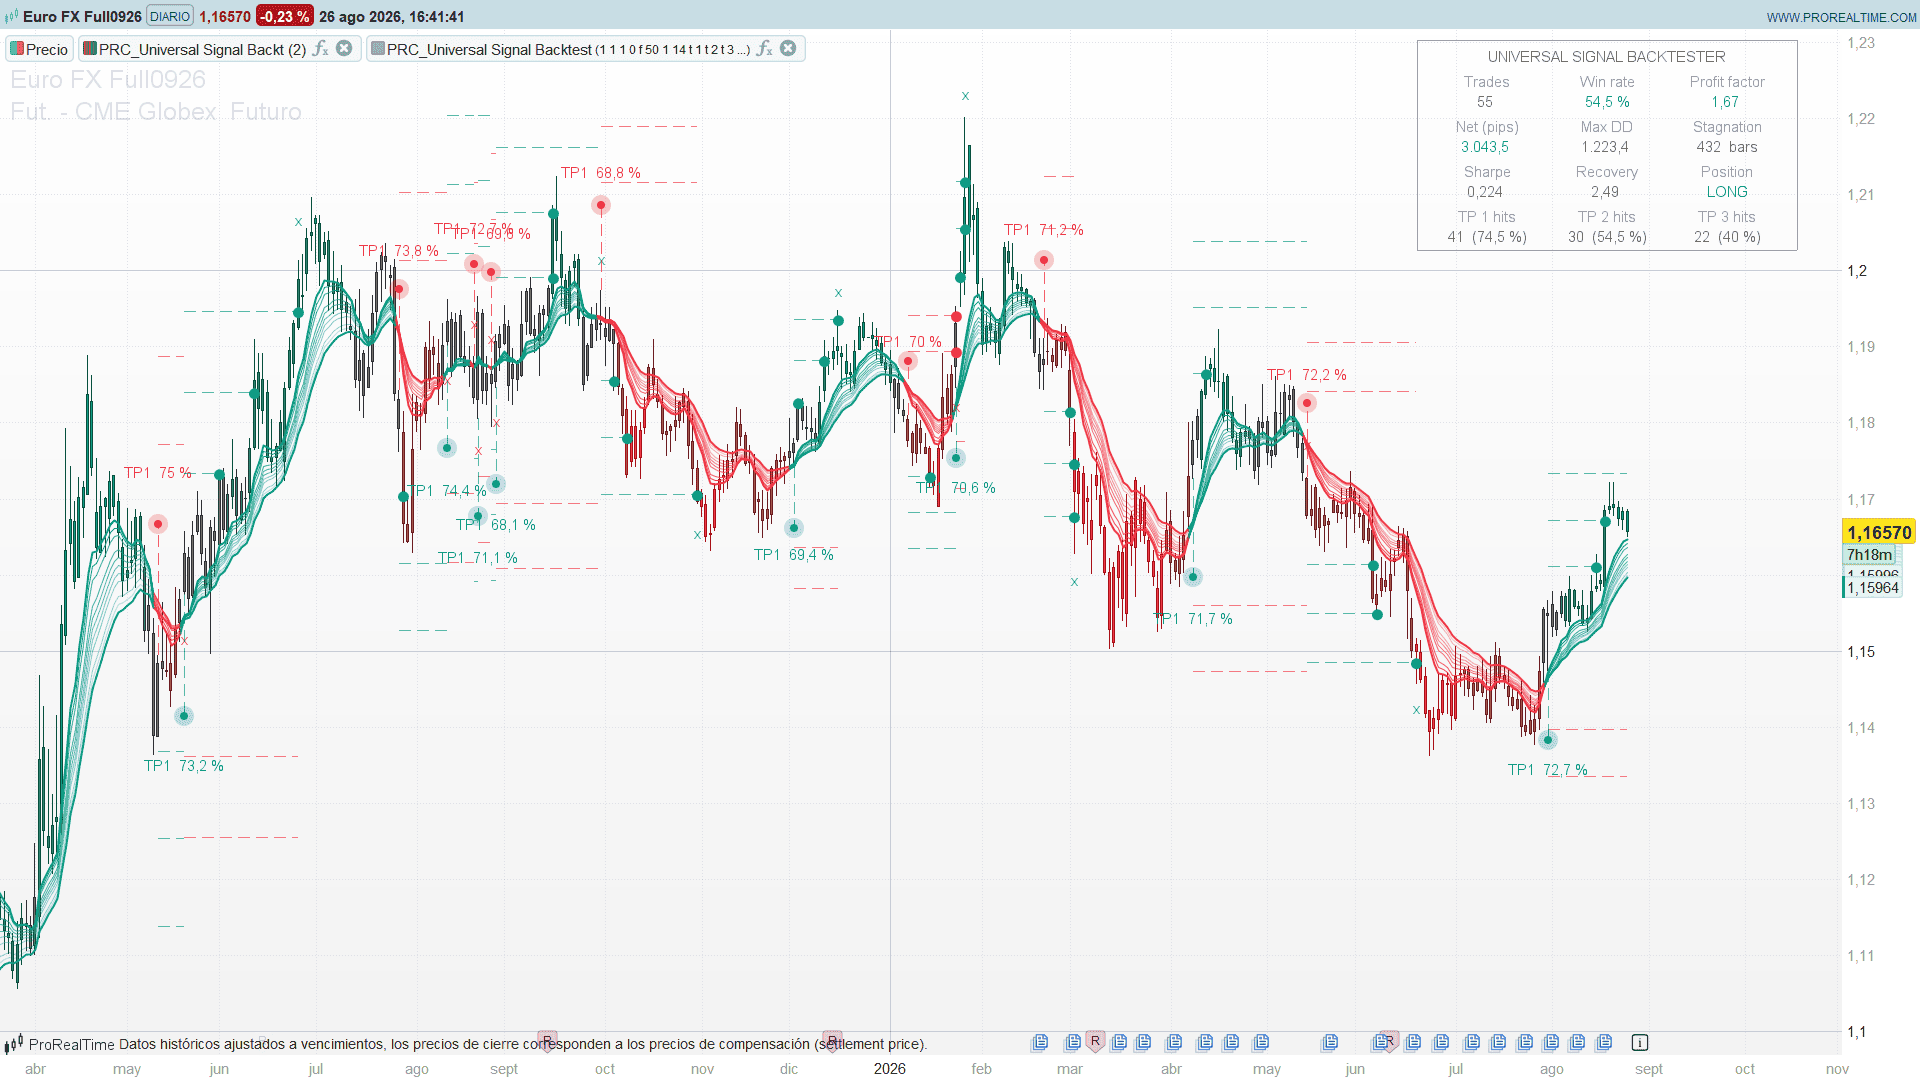
The Universal Signal Backtester, designed by LuxAlgo, is built around exactly that gap. It is not a system and it does not tell you when to buy. It is a test bench: you feed it a signal, it simulates the whole trade with three partial take profits and three staggered stop losses, and it keeps score. After a few hundred bars it can tell you which target distance has actually been paying on your chart.
How It Works
On every signal the engine opens one virtual position of size 1 and manages it until it is empty:
- Three take profits (default 1.0, 2.0 and 3.0 ATR from entry). Each one that is reached closes an equal slice of the position and books its own result. With all three enabled, each one takes a third.
- Three stop losses (default 1.5, 2.5 and 3.5 ATR). These do not work in slices: whichever is reached first closes everything that is left. The extra two exist so you can see how far price ran against the trade before it turned.
- Opposite signal: if neither side is reached, the remaining size closes at the close of the bar where the opposite signal fires — and the new position can open on that same bar.
Stops are evaluated before targets on every bar, which is the conservative assumption: when a bar touches both, the loss is the one that counts.
Distances can be measured in ATR (default, so the test adapts to volatility), in pips, or in raw price points.
The Suggested Take Profit
This is the feature that makes the indicator worth keeping on a chart. Every entry marker carries a label like TP2 45.3%.
That label is not a prediction. It is the take profit that scores best on the trades already recorded up to that bar, together with its hit rate. Four scoring metrics are available:
- Hit rate — the target reached most often
- Expected profit — hit rate multiplied by target distance, so a rarely-reached far target can still win
- Total profit — accumulated distance actually captured
- Risk/reward — target distance against the first stop distance
Watching that label drift from TP3 to TP1 as a market changes character is far more informative than any static rule about where to place an objective.
The Dashboard
A compact panel in the top-right corner keeps the running score of the whole simulation:
- Trades, Win rate and Profit factor — the basics, colour-coded green above the neutral threshold
- Net (pips), Max DD and Stagnation — net result, worst equity drawdown, and the longest stretch in bars without a new equity high
- Sharpe and Recovery — per-trade Sharpe ratio (mean result over its standard deviation) and net result over max drawdown
- Position — LONG, SHORT or FLAT right now
- TP 1 / TP 2 / TP 3 hits — how many times each target was reached and what share of all trades that is
The hit counters are the ones to watch alongside the win rate. A configuration that shows 68% on TP1 and 12% on TP3 is telling you something concrete about how far this instrument tends to travel after your signal.
Signal Sources
Three modes, so the same test bench can be pointed at almost anything:
1. Predefined crosses. Three classic pairs — 9/21 EMA, 12/26 EMA, and the 50/200 SMA golden/death cross. A ribbon of nine intermediate averages is drawn between the fast and slow lines, fading out and flipping green or red with the trend. It is the quickest way to get a feel for the tool before plugging your own work into it.
2. External crossover. Two series of your own that cross each other.
3. External trigger. One long series and one short series from your own indicator, read in whichever way suits it: a marker that only exists on the signal bar, a cross above or below zero, a change of value, or simply being positive or negative.
Filters and Costs
A choppiness filter is available: when enabled, signals are ignored while ATR sits below its own moving average. Range-bound phases are where crossover signals cluster and die, and filtering them out usually cleans the statistics considerably.
Trade direction can be restricted to long only or short only.
Costs are off by default, which makes the raw statistics comparable between configurations. Turn them on and every trade pays a spread plus a commission on the round trip, either manually or through three presets (forex, tier-1 crypto, US stocks). Numbers with costs on are much closer to what an execution would really look like — a signal with a profit factor of 1.15 frictionless can easily be a losing one after spread.
Visual Elements
- Entry marker: a dotted ray from the bar with a glowing dot at the end, plus the suggested take profit label. Below the bar for longs, above for shorts.
- Target and stop levels: horizontal dotted lines from entry, green for targets and red for stops, each one ending exactly where it was reached — with a dot marking the spot — or where the trade closed.
- Outcome mark: a small x at the closing bar, green if the trade ended in profit and red if it did not.
- Ribbon: eleven averages between the fast and slow lines, alpha-graded, coloured by the current trend.
- Gradient candles (a separate companion indicator, see the code section): candles shaded from red to green according to how far apart the two averages are, normalised over the last 100 bars. Load it on the same price chart if you want the full look.
The chart keeps the 20 most recent trades drawn by default. Raise or lower maxDraw depending on how much history you want to see at once — and lower it if the chart feels heavy on a fast timeframe.
How to Read It
- Start in predefined mode with the 9/21 EMA cross on the instrument and timeframe you actually trade. Let it run over the whole loaded history.
- Read the TP hit counters before anything else. They tell you where the movement usually stops.
- Move the target multipliers until the hit rates make sense for your style — a very high TP1 rate with a poor profit factor usually means the targets are too close to pay for the stops.
- Enable the choppiness filter and compare. If the statistics improve a lot, your signal has a range problem, not a target problem.
- Turn costs on before believing any of the numbers.
- Only then plug in your own signal through the external hook and repeat the exercise.
Practical Applications
- Target calibration: the core use. Stop guessing the distance and read it off your own instrument.
- Signal comparison: run the same target and stop configuration against two different signals and compare profit factor and net result directly.
- Stop stress test: three stops at different distances show how much room a signal actually needs. If most trades stop out at the first level but the third is rarely touched, the stop is too tight.
- Sanity check before ProBacktest: this is a frictionless, single-unit simulation with no slippage and no position sizing. Use it to reject bad ideas fast and cheaply; take the survivors to ProBacktest for a real test.
Indicator Configuration
Everything is set at the top of the code, one constant per line:
- Source mode (1 predefined / 2 external crossover / 3 external trigger) and predefined pair (1 = 9/21 EMA, 2 = 12/26 EMA, 3 = 50/200 SMA)
- Trigger reading for mode 3 (1 marker, 2 crosses over 0, 3 crosses under 0, 4 value changes, 5 greater than 0, 6 less than 0)
- Trade direction (0 both / 1 long only / 2 short only)
- Choppiness filter on/off (default 0) and its smoothing length (default 50)
- Distance type (1 ATR / 2 pips / 3 points) and ATR length (default 14)
- Take profit 1/2/3 on/off and multipliers (defaults 1.0, 2.0, 3.0)
- Stop loss 1/2/3 on/off and multipliers (defaults 1.5, 2.5, 3.5)
- Costs on/off (default 0), profile (1 manual / 2 forex / 3 crypto / 4 US stocks), manual spread in pips and manual commission in percent
- Dashboard on/off, scoring metric (1 hit rate / 2 expected profit / 3 total profit / 4 risk-reward), and the three panel dials dashX, dashY, dashCol
- Entry markers on/off, level lines on/off, and maxDraw (default 20)
The panel is drawn as a plain frame with no fill, so it stays readable on light and dark charts alike. Text is centred on each column point, which means the frame reserves half a column on each side — if something gets clipped by the price scale at your screen resolution, widen dashCol or make dashX more negative. If you prefer another corner, edit the anchor(…) keyword.
All results are expressed in pips, using the instrument’s own pip size. To force a different unit, change the single pipRef line near the top.
Code
Two indicators, both to be loaded on the price chart. The second one is optional and only adds the candle colouring.
//----------------------------------------------------------//
//PRC_Universal Signal Backtester (by LuxAlgo)
//version = 0
//26.08.26
//Iván González @ www.prorealcode.com
//Sharing ProRealTime knowledge
//----------------------------------------------------------//
defparam drawonlastbaronly = true
//-----Source settings---------------------------------------//
sourceMode  = 1     // 1 = predefined cross / 2 = external crossover / 3 = external trigger
predefCross = 1     // 1 = 9/21 EMA / 2 = 12/26 EMA / 3 = golden-death cross (50/200 SMA)
signalLogic = 1     // trigger reading, mode 3 only: 1 = not undefined (markers) / 2 = crosses over 0
// 3 = crosses under 0 / 4 = value changes / 5 = greater than 0 / 6 = less than 0
sideMode    = 0     // 0 = both / 1 = long only / 2 = short only
//-----Filters-----------------------------------------------//
useAtrFilter = 0    // 1 = skip signals while ATR sits below its own average (choppiness filter)
atrFilterLen = 50   // smoothing length of that filter
//-----Target settings---------------------------------------//
distType = 1        // 1 = ATR / 2 = pips / 3 = price points
atrLen   = 14       // ATR length, used when distType = 1
useTp1 = 1
tp1Val = 1.0
useTp2 = 1
tp2Val = 2.0
useTp3 = 1
tp3Val = 3.0
useSl1 = 1
sl1Val = 1.5
useSl2 = 1
sl2Val = 2.5
useSl3 = 1
sl3Val = 3.5
//-----Costs-------------------------------------------------//
useCosts     = 0    // 1 = subtract spread and commission from every trade
costProfile  = 1    // 1 = manual / 2 = forex (avg) / 3 = crypto (tier 1) / 4 = US stocks
manualSpread = 1.0  // spread per round trip, in pips
manualComm   = 0.01 // commission per round trip, % of position value
//-----Dashboard---------------------------------------------//
showDash      = 1
suggestMetric = 1   // 1 = hit rate / 2 = expected profit / 3 = total profit / 4 = risk-reward
dashX   = -430      // panel: horizontal offset of the first column (from the right edge)
dashY   = -20       // panel: vertical offset (from the top edge)
dashCol = 120       // panel: column width (the frame adds half a column on each side)
//-----Visuals-----------------------------------------------//
showEntry  = 1      // entry marker with the suggested take profit
showLevels = 1      // take profit / stop loss levels of every trade
maxDraw    = 20     // most recent trades kept on the chart (the original caps at 500 lines)
//-----Colors------------------------------------------------//
bullR = 8
bullG = 153
bullB = 129
bearR = 242
bearG = 54
bearB = 69
neuR = 144          // dashboard headers: mid grey, readable on light AND dark charts
neuG = 144
neuB = 144
txtR = 108          // dashboard values: darker grey, same safe luminance band
txtG = 108
txtB = 108
//----------------------------------------------------------//
//-----Pip reference-----------------------------------------//
// every result is expressed in pips; replace with a fixed
// number (0.0001, 0.25...) to force your own tick size
pipRef = pipsize
if pipRef <= 0 then
   pipRef = 1
endif
//-----Predefined cross and its ribbon-----------------------//
if predefCross = 2 then
   fastLen = 12
   slowLen = 26
   maType  = 1
elsif predefCross = 3 then
   fastLen = 50
   slowLen = 200
   maType  = 0
else
   fastLen = 9
   slowLen = 21
   maType  = 1
endif

stepLen = (slowLen - fastLen) / 10
lg1 = round(fastLen + stepLen)
lg2 = round(fastLen + stepLen * 2)
lg3 = round(fastLen + stepLen * 3)
lg4 = round(fastLen + stepLen * 4)
lg5 = round(fastLen + stepLen * 5)
lg6 = round(fastLen + stepLen * 6)
lg7 = round(fastLen + stepLen * 7)
lg8 = round(fastLen + stepLen * 8)
lg9 = round(fastLen + stepLen * 9)

if maType = 1 then
   builtFast = average[fastLen,1](close)
   builtSlow = average[slowLen,1](close)
   rb1 = average[lg1,1](close)
   rb2 = average[lg2,1](close)
   rb3 = average[lg3,1](close)
   rb4 = average[lg4,1](close)
   rb5 = average[lg5,1](close)
   rb6 = average[lg6,1](close)
   rb7 = average[lg7,1](close)
   rb8 = average[lg8,1](close)
   rb9 = average[lg9,1](close)
else
   builtFast = average[fastLen](close)
   builtSlow = average[slowLen](close)
   rb1 = average[lg1](close)
   rb2 = average[lg2](close)
   rb3 = average[lg3](close)
   rb4 = average[lg4](close)
   rb5 = average[lg5](close)
   rb6 = average[lg6](close)
   rb7 = average[lg7](close)
   rb8 = average[lg8](close)
   rb9 = average[lg9](close)
endif
//-----External hook-----------------------------------------//
// Mode 2 feeds on two series that cross each other, mode 3 on
// two trigger series. Replace the four lines below with your
// own indicator, e.g. extFast = CALL "My Indicator"[14]
extFast  = close
extSlow  = average[20](close)
extLong  = 0
extShort = 0

if sourceMode = 1 then
   activeFast = builtFast
   activeSlow = builtSlow
else
   activeFast = extFast
   activeSlow = extSlow
endif
//-----Raw signals-------------------------------------------//
baseLong  = 0
baseShort = 0
if sourceMode = 1 or sourceMode = 2 then
   if activeFast crosses over activeSlow then
      baseLong = 1
   endif
   if activeFast crosses under activeSlow then
      baseShort = 1
   endif
else
   if signalLogic = 2 then
      if extLong crosses over 0 then
         baseLong = 1
      endif
      if extShort crosses over 0 then
         baseShort = 1
      endif
   elsif signalLogic = 3 then
      if extLong crosses under 0 then
         baseLong = 1
      endif
      if extShort crosses under 0 then
         baseShort = 1
      endif
   elsif signalLogic = 4 then
      if extLong <> extLong[1] then
         baseLong = 1
      endif
      if extShort <> extShort[1] then
         baseShort = 1
      endif
   elsif signalLogic = 5 then
      if extLong > 0 then
         baseLong = 1
      endif
      if extShort > 0 then
         baseShort = 1
      endif
   elsif signalLogic = 6 then
      if extLong < 0 then
         baseLong = 1
      endif
      if extShort < 0 then
         baseShort = 1
      endif
   else
      if extLong <> undefined and extLong[1] = undefined then
         baseLong = 1
      endif
      if extShort <> undefined and extShort[1] = undefined then
         baseShort = 1
      endif
   endif
endif
//-----Choppiness filter and direction gate------------------//
atrBase = averagetruerange[14]
atrOk = 1
if useAtrFilter = 1 and atrBase <= average[atrFilterLen](atrBase) then
   atrOk = 0
endif

longCond  = baseLong * atrOk
shortCond = baseShort * atrOk

canLong = 0
canShort = 0
if sideMode = 0 or sideMode = 1 then
   canLong = 1
endif
if sideMode = 0 or sideMode = 2 then
   canShort = 1
endif
//-----Distance unit and costs-------------------------------//
atrVal = averagetruerange[atrLen]
if distType = 2 then
   multi = pipRef
elsif distType = 3 then
   multi = 1
else
   multi = atrVal
endif

spreadPips = 0
commPerc = 0
if useCosts = 1 then
   if costProfile = 2 then
      spreadPips = 1.0
      commPerc = 0.005
   elsif costProfile = 3 then
      spreadPips = 1.0
      commPerc = 0.12
   elsif costProfile = 4 then
      spreadPips = 2.0
      commPerc = 0
   else
      spreadPips = manualSpread
      commPerc = manualComm
   endif
endif
warmBars = max(atrLen, 14)
if useAtrFilter = 1 then
   warmBars = max(warmBars, atrFilterLen)
endif
if sourceMode = 1 then
   warmBars = max(warmBars, slowLen)
endif
warmOk = 0
if barindex > warmBars then
   warmOk = 1
endif
//-----Level table (read back by the drawing loop)-----------//
$lvUse[0] = useTp1
$lvUse[1] = useTp2
$lvUse[2] = useTp3
$lvUse[3] = useSl1
$lvUse[4] = useSl2
$lvUse[5] = useSl3
$lvDist[0] = tp1Val
$lvDist[1] = tp2Val
$lvDist[2] = tp3Val
$lvDist[3] = sl1Val
$lvDist[4] = sl2Val
$lvDist[5] = sl3Val
//----------------------------------------------------------//
//-----Simulation state--------------------------------------//
once isActive = 0
once posDir = 0
once entryPx = 0
once entryBar = 0
once qtyLeft = 0
once tradePnl = 0
once mulE = 0
once bestTpE = 0
once bestRateE = 0
once hTp1 = -1
once hTp2 = -1
once hTp3 = -1
once hSl1 = -1
once hSl2 = -1
once hSl3 = -1
once nTrades = 0
once nWins = 0
once grossWin = 0
once grossLoss = 0
once eqNow = 0
once eqMax = 0
once maxDd = 0
once eqHighBar = 0
once maxStag = 0
once sumPnl = 0
once sumSq = 0
once tp1Hits = 0
once tp2Hits = 0
once tp3Hits = 0
once nDrawn = 0

nTpAct = useTp1 + useTp2 + useTp3
if nTpAct < 1 then
   nTpAct = 1
endif
tpQty = 1 / nTpAct
unitCost = spreadPips + entryPx * commPerc / 100 / pipRef

closedNow = 0
//-----Exits-------------------------------------------------//
if isActive = 1 then
   // 1. stop losses first: the closest one closes the whole remaining size
   slHit = 0
   slPx = 0
   if useSl1 = 1 and hSl1 = -1 then
      lv = entryPx - posDir * sl1Val * mulE
      if (posDir = 1 and low <= lv) or (posDir = -1 and high >= lv) then
         hSl1 = barindex
         slHit = 1
         slPx = lv
      endif
   endif
   if useSl2 = 1 and hSl2 = -1 then
      lv = entryPx - posDir * sl2Val * mulE
      if (posDir = 1 and low <= lv) or (posDir = -1 and high >= lv) then
         hSl2 = barindex
         if slHit = 0 then
            slHit = 1
            slPx = lv
         endif
      endif
   endif
   if useSl3 = 1 and hSl3 = -1 then
      lv = entryPx - posDir * sl3Val * mulE
      if (posDir = 1 and low <= lv) or (posDir = -1 and high >= lv) then
         hSl3 = barindex
         if slHit = 0 then
            slHit = 1
            slPx = lv
         endif
      endif
   endif
   if slHit = 1 then
      tradePnl = tradePnl + (slPx - entryPx) * posDir / pipRef * qtyLeft - unitCost * qtyLeft
      qtyLeft = 0
      closedNow = 1
   endif

   // 2. take profits: each one books its own slice of the position
   if closedNow = 0 then
      if useTp1 = 1 and hTp1 = -1 then
         lv = entryPx + posDir * tp1Val * mulE
         if (posDir = 1 and high >= lv) or (posDir = -1 and low <= lv) then
            hTp1 = barindex
            tp1Hits = tp1Hits + 1
            tradePnl = tradePnl + (lv - entryPx) * posDir / pipRef * tpQty - unitCost * tpQty
            qtyLeft = qtyLeft - tpQty
         endif
      endif
      if useTp2 = 1 and hTp2 = -1 then
         lv = entryPx + posDir * tp2Val * mulE
         if (posDir = 1 and high >= lv) or (posDir = -1 and low <= lv) then
            hTp2 = barindex
            tp2Hits = tp2Hits + 1
            tradePnl = tradePnl + (lv - entryPx) * posDir / pipRef * tpQty - unitCost * tpQty
            qtyLeft = qtyLeft - tpQty
         endif
      endif
      if useTp3 = 1 and hTp3 = -1 then
         lv = entryPx + posDir * tp3Val * mulE
         if (posDir = 1 and high >= lv) or (posDir = -1 and low <= lv) then
            hTp3 = barindex
            tp3Hits = tp3Hits + 1
            tradePnl = tradePnl + (lv - entryPx) * posDir / pipRef * tpQty - unitCost * tpQty
            qtyLeft = qtyLeft - tpQty
         endif
      endif
      if qtyLeft <= 0.001 then
         closedNow = 1
      endif
   endif

   // 3. opposite signal closes whatever is left at the close
   if closedNow = 0 then
      if (posDir = 1 and shortCond = 1) or (posDir = -1 and longCond = 1) then
         tradePnl = tradePnl + (close - entryPx) * posDir / pipRef * qtyLeft - unitCost * qtyLeft
         qtyLeft = 0
         closedNow = 1
      endif
   endif
endif
//-----Bookkeeping-------------------------------------------//
if closedNow = 1 then
   isActive = 0
   nTrades = nTrades + 1
   sumPnl = sumPnl + tradePnl
   sumSq = sumSq + tradePnl * tradePnl
   if tradePnl > 0 then
      nWins = nWins + 1
      grossWin = grossWin + tradePnl
   elsif tradePnl < 0 then
      grossLoss = grossLoss + abs(tradePnl)
   endif
   eqNow = eqNow + tradePnl
   if eqNow > eqMax then
      eqMax = eqNow
      eqHighBar = barindex
   endif
   if eqMax - eqNow > maxDd then
      maxDd = eqMax - eqNow
   endif

   slot = nDrawn - floor(nDrawn / maxDraw) * maxDraw
   $rBar[slot] = entryBar
   $rPx[slot] = entryPx
   $rDir[slot] = posDir
   $rMul[slot] = mulE
   $rOut[slot] = barindex
   $rBt[slot] = bestTpE
   $rBr[slot] = bestRateE
   $rRes[slot] = 0
   if tradePnl > 0 then
      $rRes[slot] = 1
   endif
   $rHit[slot * 6] = hTp1
   $rHit[slot * 6 + 1] = hTp2
   $rHit[slot * 6 + 2] = hTp3
   $rHit[slot * 6 + 3] = hSl1
   $rHit[slot * 6 + 4] = hSl2
   $rHit[slot * 6 + 5] = hSl3
   nDrawn = nDrawn + 1
endif
//-----Entries-----------------------------------------------//
if isActive = 0 then
   newDir = 0
   if longCond = 1 and canLong = 1 then
      newDir = 1
   elsif shortCond = 1 and canShort = 1 then
      newDir = -1
   endif

   if newDir <> 0 and warmOk = 1 then
      // suggested take profit, scored on what the past trades did
      itr = max(1, nTrades)
      rate1 = tp1Hits / itr
      rate2 = tp2Hits / itr
      rate3 = tp3Hits / itr
      slDist = max(pipRef, sl1Val * multi)
      if suggestMetric = 2 then
         v1 = rate1 * tp1Val * multi
         v2 = rate2 * tp2Val * multi
         v3 = rate3 * tp3Val * multi
      elsif suggestMetric = 3 then
         v1 = tp1Hits * tp1Val * multi
         v2 = tp2Hits * tp2Val * multi
         v3 = tp3Hits * tp3Val * multi
      elsif suggestMetric = 4 then
         v1 = tp1Val * multi / slDist
         v2 = tp2Val * multi / slDist
         v3 = tp3Val * multi / slDist
      else
         v1 = rate1 * 100
         v2 = rate2 * 100
         v3 = rate3 * 100
      endif
      bestV = 0
      bestTp = 0
      bestRate = 0
      if useTp1 = 1 then
         bestV = v1
         bestTp = 1
         bestRate = rate1 * 100
      endif
      if useTp2 = 1 and (bestTp = 0 or v2 > bestV) then
         bestV = v2
         bestTp = 2
         bestRate = rate2 * 100
      endif
      if useTp3 = 1 and (bestTp = 0 or v3 > bestV) then
         bestV = v3
         bestTp = 3
         bestRate = rate3 * 100
      endif

      isActive = 1
      posDir = newDir
      entryPx = close
      entryBar = barindex
      qtyLeft = 1
      tradePnl = 0
      mulE = multi
      bestTpE = bestTp
      bestRateE = round(bestRate, 1)
      hTp1 = -1
      hTp2 = -1
      hTp3 = -1
      hSl1 = -1
      hSl2 = -1
      hSl3 = -1
      if eqHighBar = 0 then
         eqHighBar = barindex
      endif
   endif
endif
//-----Open trade lives in the pending slot------------------//
if isActive = 1 then
   slot = nDrawn - floor(nDrawn / maxDraw) * maxDraw
   $rBar[slot] = entryBar
   $rPx[slot] = entryPx
   $rDir[slot] = posDir
   $rMul[slot] = mulE
   $rOut[slot] = barindex
   $rBt[slot] = bestTpE
   $rBr[slot] = bestRateE
   $rRes[slot] = 2
   $rHit[slot * 6] = hTp1
   $rHit[slot * 6 + 1] = hTp2
   $rHit[slot * 6 + 2] = hTp3
   $rHit[slot * 6 + 3] = hSl1
   $rHit[slot * 6 + 4] = hSl2
   $rHit[slot * 6 + 5] = hSl3
endif

if eqHighBar > 0 and barindex - eqHighBar > maxStag then
   maxStag = barindex - eqHighBar
endif
//----------------------------------------------------------//
//-----Drawings (rebuilt on the last bar)--------------------//
if islastbarupdate then

   nShow = min(nDrawn + isActive, maxDraw)
   if nShow > 0 then
      for k = 0 to nShow - 1 do
         dr = $rDir[k]
         eb = $rBar[k]
         ep = $rPx[k]
         mu = $rMul[k]
         ob = $rOut[k]
         if dr = 1 then
            cR = bullR
            cG = bullG
            cB = bullB
         else
            cR = bearR
            cG = bearG
            cB = bearB
         endif

         // take profit and stop loss levels, cut where they were reached
         if showLevels = 1 then
            for j = 0 to 5 do
               if $lvUse[j] = 1 then
                  isgn = 1
                  if j > 2 then
                     isgn = -1
                  endif
                  yv = ep + dr * isgn * $lvDist[j] * mu
                  hb = $rHit[k * 6 + j]
                  xe = ob
                  if hb >= 0 then
                     xe = hb
                  endif
                  if j > 2 then
                     drawsegment(eb, yv, xe, yv) coloured(bearR, bearG, bearB, 170) style(dottedline2, 1)
                     if hb >= 0 then
                        drawtext("●", xe, yv) coloured(bearR, bearG, bearB, 255)
                     endif
                  else
                     drawsegment(eb, yv, xe, yv) coloured(bullR, bullG, bullB, 170) style(dottedline2, 1)
                     if hb >= 0 then
                        drawtext("●", xe, yv) coloured(bullR, bullG, bullB, 255)
                     endif
                  endif
               endif
            next
         endif

         // entry marker with the take profit the engine was favouring
         if showEntry = 1 then
            off = barindex - eb
            if dr = 1 then
               y1 = low[off]
               y2 = y1 - mu * 1.5
               ytx = y2 - mu * 0.6
            else
               y1 = high[off]
               y2 = y1 + mu * 1.5
               ytx = y2 + mu * 0.6
            endif
            drawsegment(eb, y1, eb, y2) coloured(cR, cG, cB, 190) style(dottedline2, 1)
            drawpoint(eb, y2, 5) coloured(cR, cG, cB, 70)
            drawpoint(eb, y2, 2) coloured(cR, cG, cB, 255)
            bt = $rBt[k]
            br = $rBr[k]
            drawtext("TP#bt# #br#%", eb, ytx) coloured(cR, cG, cB, 255)
         endif

         // outcome of the closed trade
         rs = $rRes[k]
         if rs < 2 then
            ofb = barindex - ob
            if dr = 1 then
               ymk = high[ofb] + mu * 0.5
            else
               ymk = low[ofb] - mu * 0.5
            endif
            if rs = 1 then
               drawtext("x", ob, ymk) coloured(bullR, bullG, bullB, 255)
            else
               drawtext("x", ob, ymk) coloured(bearR, bearG, bearB, 255)
            endif
         endif
      next
   endif
   //-----Dashboard------------------------------------------//
   if showDash = 1 then
      wrV = 0
      if nTrades > 0 then
         wrV = round(nWins / nTrades * 100, 1)
      endif
      if grossLoss > 0 then
         pfV = round(grossWin / grossLoss, 2)
      elsif grossWin > 0 then
         pfV = 99.9
      else
         pfV = 0
      endif
      if maxDd > 0 then
         rfV = round(eqNow / maxDd, 2)
      elsif eqNow > 0 then
         rfV = 99.9
      else
         rfV = 0
      endif
      shV = 0
      if nTrades > 0 then
         meanP = sumPnl / nTrades
         varP = sumSq / nTrades - meanP * meanP
         if varP > 0 then
            shV = round(meanP / sqrt(varP), 3)
         endif
      endif
      netV = round(eqNow, 1)
      ddV = round(maxDd, 1)
      t1p = 0
      t2p = 0
      t3p = 0
      if nTrades > 0 then
         t1p = round(tp1Hits / nTrades * 100, 1)
         t2p = round(tp2Hits / nTrades * 100, 1)
         t3p = round(tp3Hits / nTrades * 100, 1)
      endif

      cx1 = dashX
      cx2 = dashX + dashCol
      cx3 = dashX + dashCol * 2
      // DRAWTEXT centres the string on the anchor point, so the frame has to
      // clear half a column on each side and the title sits on the middle column
      halfCol = dashCol / 2
      boxL = dashX - halfCol - 10
      boxR = cx3 + halfCol + 10

      drawrectangle(boxL, dashY + 10, boxR, dashY - 200) anchor(topright, xshift, yshift) coloured(neuR, neuG, neuB, 200)
      drawtext("UNIVERSAL SIGNAL BACKTESTER", cx2, dashY - 5) anchor(topright, xshift, yshift) coloured(txtR, txtG, txtB, 255)

      drawtext("Trades", cx1, dashY - 30) anchor(topright, xshift, yshift) coloured(neuR, neuG, neuB, 255)
      drawtext("Win rate", cx2, dashY - 30) anchor(topright, xshift, yshift) coloured(neuR, neuG, neuB, 255)
      drawtext("Profit factor", cx3, dashY - 30) anchor(topright, xshift, yshift) coloured(neuR, neuG, neuB, 255)
      drawtext("#nTrades#", cx1, dashY - 50) anchor(topright, xshift, yshift) coloured(txtR, txtG, txtB, 255)
      if wrV >= 50 then
         drawtext("#wrV#%", cx2, dashY - 50) anchor(topright, xshift, yshift) coloured(bullR, bullG, bullB, 255)
      else
         drawtext("#wrV#%", cx2, dashY - 50) anchor(topright, xshift, yshift) coloured(bearR, bearG, bearB, 255)
      endif
      if pfV >= 1 then
         drawtext("#pfV#", cx3, dashY - 50) anchor(topright, xshift, yshift) coloured(bullR, bullG, bullB, 255)
      else
         drawtext("#pfV#", cx3, dashY - 50) anchor(topright, xshift, yshift) coloured(bearR, bearG, bearB, 255)
      endif

      drawtext("Net (pips)", cx1, dashY - 75) anchor(topright, xshift, yshift) coloured(neuR, neuG, neuB, 255)
      drawtext("Max DD", cx2, dashY - 75) anchor(topright, xshift, yshift) coloured(neuR, neuG, neuB, 255)
      drawtext("Stagnation", cx3, dashY - 75) anchor(topright, xshift, yshift) coloured(neuR, neuG, neuB, 255)
      if netV >= 0 then
         drawtext("#netV#", cx1, dashY - 95) anchor(topright, xshift, yshift) coloured(bullR, bullG, bullB, 255)
      else
         drawtext("#netV#", cx1, dashY - 95) anchor(topright, xshift, yshift) coloured(bearR, bearG, bearB, 255)
      endif
      drawtext("#ddV#", cx2, dashY - 95) anchor(topright, xshift, yshift) coloured(txtR, txtG, txtB, 255)
      drawtext("#maxStag# bars", cx3, dashY - 95) anchor(topright, xshift, yshift) coloured(txtR, txtG, txtB, 255)

      drawtext("Sharpe", cx1, dashY - 120) anchor(topright, xshift, yshift) coloured(neuR, neuG, neuB, 255)
      drawtext("Recovery", cx2, dashY - 120) anchor(topright, xshift, yshift) coloured(neuR, neuG, neuB, 255)
      drawtext("Position", cx3, dashY - 120) anchor(topright, xshift, yshift) coloured(neuR, neuG, neuB, 255)
      drawtext("#shV#", cx1, dashY - 140) anchor(topright, xshift, yshift) coloured(txtR, txtG, txtB, 255)
      drawtext("#rfV#", cx2, dashY - 140) anchor(topright, xshift, yshift) coloured(txtR, txtG, txtB, 255)
      if isActive = 1 and posDir = 1 then
         drawtext("LONG", cx3, dashY - 140) anchor(topright, xshift, yshift) coloured(bullR, bullG, bullB, 255)
      elsif isActive = 1 then
         drawtext("SHORT", cx3, dashY - 140) anchor(topright, xshift, yshift) coloured(bearR, bearG, bearB, 255)
      else
         drawtext("FLAT", cx3, dashY - 140) anchor(topright, xshift, yshift) coloured(neuR, neuG, neuB, 255)
      endif

      drawtext("TP 1 hits", cx1, dashY - 165) anchor(topright, xshift, yshift) coloured(neuR, neuG, neuB, 255)
      drawtext("TP 2 hits", cx2, dashY - 165) anchor(topright, xshift, yshift) coloured(neuR, neuG, neuB, 255)
      drawtext("TP 3 hits", cx3, dashY - 165) anchor(topright, xshift, yshift) coloured(neuR, neuG, neuB, 255)
      drawtext("#tp1Hits# (#t1p#%)", cx1, dashY - 185) anchor(topright, xshift, yshift) coloured(txtR, txtG, txtB, 255)
      drawtext("#tp2Hits# (#t2p#%)", cx2, dashY - 185) anchor(topright, xshift, yshift) coloured(txtR, txtG, txtB, 255)
      drawtext("#tp3Hits# (#t3p#%)", cx3, dashY - 185) anchor(topright, xshift, yshift) coloured(txtR, txtG, txtB, 255)
   endif
endif
//----------------------------------------------------------//
//-----Ribbon plots------------------------------------------//
if activeFast > activeSlow then
   ribR = bullR
   ribG = bullG
   ribB = bullB
else
   ribR = bearR
   ribG = bearG
   ribB = bearB
endif

plFast = activeFast
plSlow = activeSlow
if sourceMode = 3 then
   plFast = undefined
   plSlow = undefined
endif

pl1 = undefined
pl2 = undefined
pl3 = undefined
pl4 = undefined
pl5 = undefined
pl6 = undefined
pl7 = undefined
pl8 = undefined
pl9 = undefined
if sourceMode = 1 then
   pl1 = rb1
   pl2 = rb2
   pl3 = rb3
   pl4 = rb4
   pl5 = rb5
   pl6 = rb6
   pl7 = rb7
   pl8 = rb8
   pl9 = rb9
endif
//----------------------------------------------------------//
return plFast as "Fast source" coloured(ribR, ribG, ribB, 255) style(line, 2), pl1 as "Ribbon 1" coloured(ribR, ribG, ribB, 234), pl2 as "Ribbon 2" coloured(ribR, ribG, ribB, 215), pl3 as "Ribbon 3" coloured(ribR, ribG, ribB, 196), pl4 as "Ribbon 4" coloured(ribR, ribG, ribB, 176), pl5 as "Ribbon 5" coloured(ribR, ribG, ribB, 157), pl6 as "Ribbon 6" coloured(ribR, ribG, ribB, 138), pl7 as "Ribbon 7" coloured(ribR, ribG, ribB, 118), pl8 as "Ribbon 8" coloured(ribR, ribG, ribB, 99), pl9 as "Ribbon 9" coloured(ribR, ribG, ribB, 80), plSlow as "Slow source" coloured(ribR, ribG, ribB, 255) style(line, 2)
//----------------------------------------------------------//
//PRC_Universal Signal Backtester - Gradient Candles (by LuxAlgo)
//version = 0
//26.08.26
//Iván González @ www.prorealcode.com
//Sharing ProRealTime knowledge
//----------------------------------------------------------//
// Companion of the Universal Signal Backtester. Candle colouring
// has to live in its own indicator: DRAWCANDLE needs to run on
// every bar and the backtester panel needs DRAWONLASTBARONLY.
//----------------------------------------------------------//
predefCross = 1     // 1 = 9/21 EMA / 2 = 12/26 EMA / 3 = golden-death cross (50/200 SMA)
normLen     = 100   // lookback used to normalise the distance between both averages
//-----Colors------------------------------------------------//
bullR = 8
bullG = 153
bullB = 129
bearR = 242
bearG = 54
bearB = 69
//----------------------------------------------------------//
if predefCross = 2 then
   fastLen = 12
   slowLen = 26
   maType  = 1
elsif predefCross = 3 then
   fastLen = 50
   slowLen = 200
   maType  = 0
else
   fastLen = 9
   slowLen = 21
   maType  = 1
endif

if maType = 1 then
   fastMa = average[fastLen,1](close)
   slowMa = average[slowLen,1](close)
else
   fastMa = average[fastLen](close)
   slowMa = average[slowLen](close)
endif

cDist = fastMa - slowMa
absDist = abs(cDist)
maxDist = average[normLen](absDist) * 2

ratioV = 0.5
if maxDist > 0 then
   ratioV = (cDist + maxDist) / (2 * maxDist)
endif
if ratioV < 0 then
   ratioV = 0
endif
if ratioV > 1 then
   ratioV = 1
endif

cr = round(bearR + (bullR - bearR) * ratioV)
cg = round(bearG + (bullG - bearG) * ratioV)
cb = round(bearB + (bullB - bearB) * ratioV)

drawcandle(open, high, low, close) coloured(cr, cg, cb)
//----------------------------------------------------------//
return