







Supertrend Parameter Sensitivity 3D
Introduction
Every Supertrend user eventually asks the same question: which ATR length and which multiplier? The usual answer is to test a few combinations and keep the one with the best result. The problem is that the best cell of a parameter grid is very often an isolated peak, surrounded by settings that perform much worse. Pick it, and a small change in market conditions is enough to fall off the cliff.
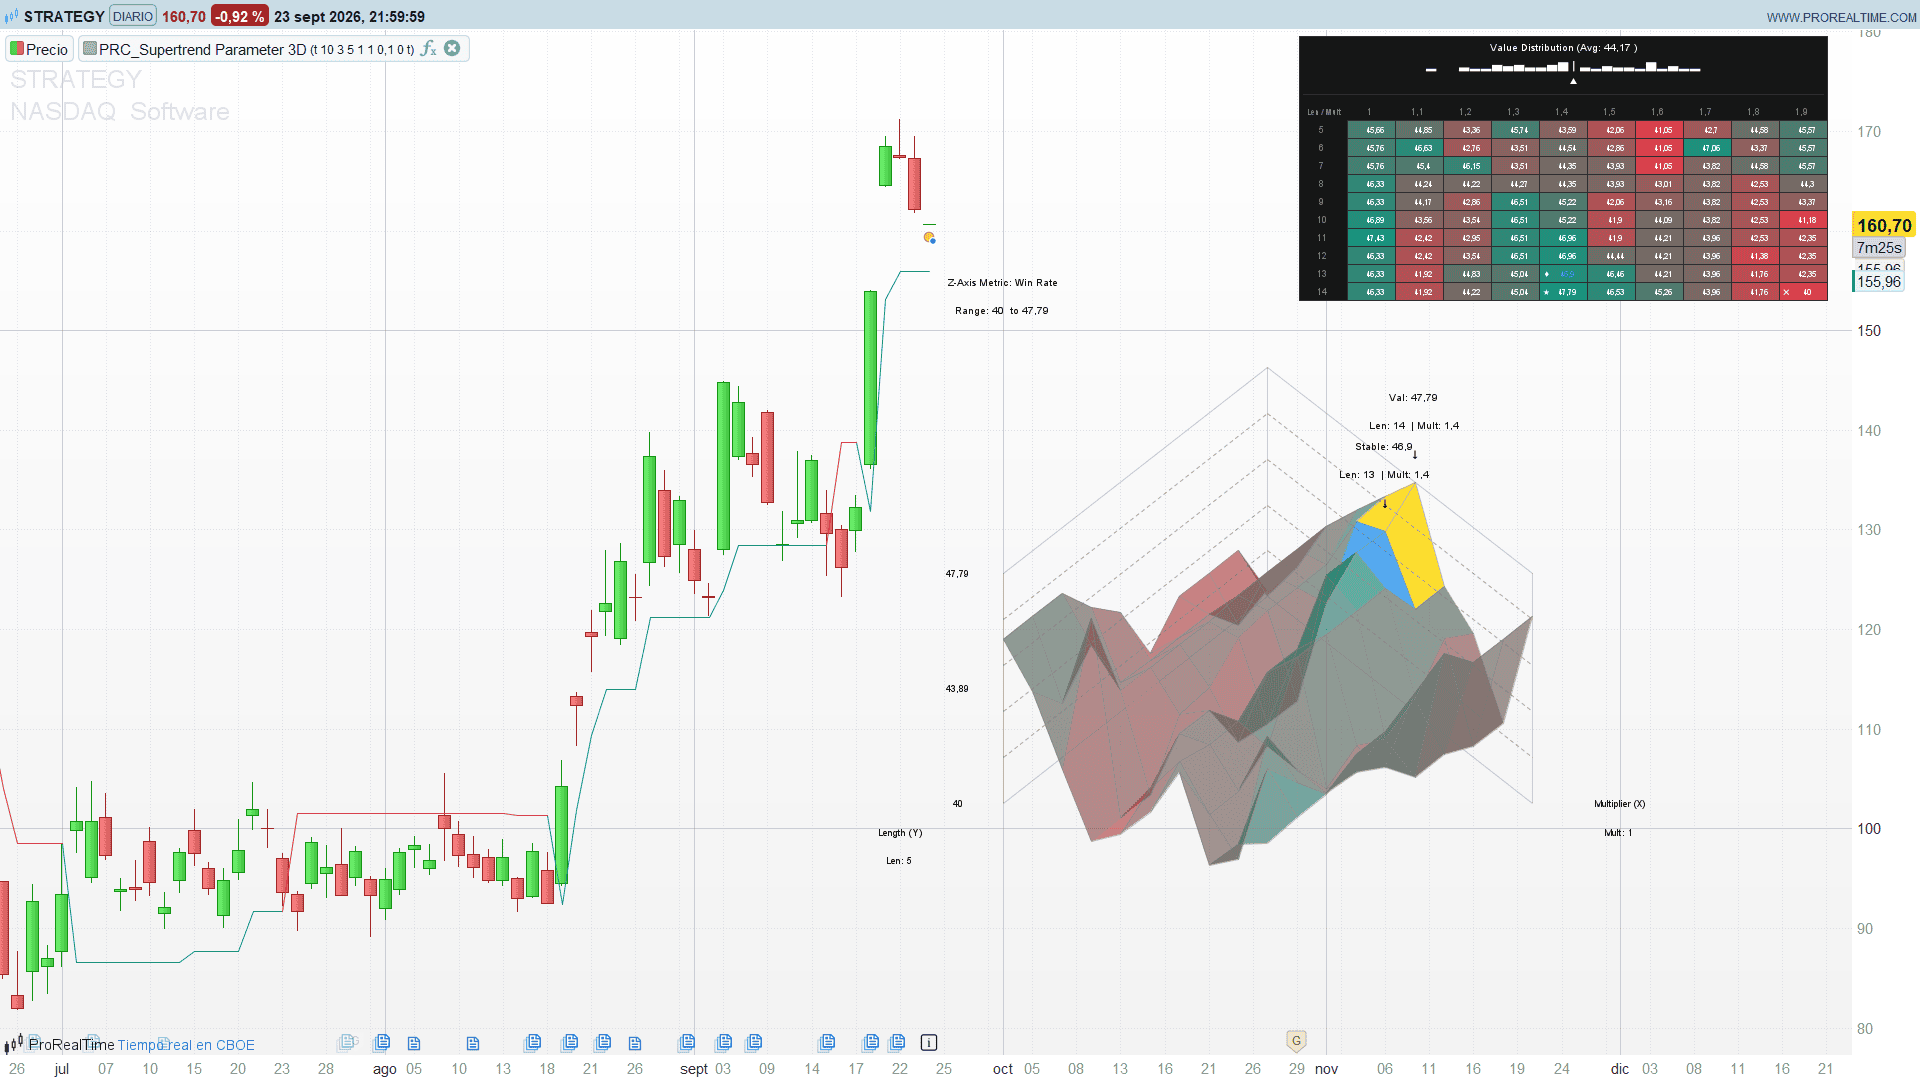
Supertrend Parameter Sensitivity 3D, by LuxAlgo, answers the question differently. It runs 100 Supertrends at the same time, keeps a simple trade record for each one, and draws the result as a 3D surface next to the price. At a glance you see whether the good results form a broad plateau or a lonely spike, and the indicator also finds the most stable area of the grid for you.
Theory Behind the Indicator
The grid
The matrix has 10 ATR lengths (rows) and 10 multipliers (columns). With the defaults, lengths go from 5 to 14 in steps of 1 and multipliers from 1.0 to 1.9 in steps of 0.1. Every cell is a complete Supertrend with its own bands and its own trend state, updated bar by bar.
The trade record
Each Supertrend is treated as an always-in-the-market system: when its trend flips, the open position is closed at the close of that bar and a new one is opened in the new direction. The profit or loss of every trade is measured in percent of the entry price. From these trades the indicator derives nine metrics, and you choose which one becomes the height of the surface:
- Win Rate
- Net Profit
- Profit Factor
- Total Trades
- Average Trade
- Reward/Risk Ratio (average win divided by average loss)
- Gross Profit
- Total Wins
- Win/Loss Ratio
The most stable area
For every inner cell, the indicator takes its 3×3 neighbourhood and computes a score: the average of the nine values minus 1.5 times their standard deviation. A high average rewards good results, the deviation penalty rewards consistency. The cell with the best score is the centre of the most stable area: a region where you can move the parameters a little and still get a similar outcome.
Key Features at a Glance
- 100 Supertrends computed simultaneously on every bar
- Nine selectable performance metrics
- Isometric 3D surface with a red to green gradient by value
- Best cell highlighted in gold, most stable area in blue, both labelled with their length and multiplier
- Dashboard with the value distribution (25 bin histogram with the average marked) and the full 10×10 matrix
- Main Supertrend plotted on price, with manual parameters or automatically switched to the most stable combination, recalculated bar by bar
How to Read the Indicator
- The shape of the surface is the main information. A wide, smooth hill means the Supertrend is robust on this instrument and timeframe: many settings work. A spiky, broken surface means the result depends heavily on the exact parameters, which is a warning sign.
- Gold cells mark the single best value of the grid. Treat it with suspicion when it stands alone.
- Blue cells mark the most stable area. This is usually the better candidate for real use, even if its value is lower than the peak.
- The histogram in the dashboard shows how the 100 results are spread. A distribution concentrated on the right means most settings do well.
- The matrix gives the exact values: the star marks the best cell, the cross the worst and the diamond the most stable.
Practical Applications
- Choosing Supertrend parameters for a new instrument or timeframe, based on a plateau rather than a peak.
- Checking robustness of settings you already use: if your parameters sit on a steep slope, a small change in volatility can change the results a lot.
- Adaptive trailing stop. With the auto apply option enabled, the plotted Supertrend always uses the most stable combination found so far.
- Comparing metrics. Switching from Win Rate to Profit Factor or Average Trade often moves the best area, which shows the trade-off between hit rate and payoff.
Keep in mind that the trade record is a simplified in-sample test: no costs, no slippage, always in the market. It is a tool to understand parameter sensitivity, not a finished backtest.
Indicator Configuration
autoApply(default: 0): set to 1 to plot the Supertrend of the most stable combination instead of the manual one.mainLen(default: 10): ATR length of the main Supertrend.mainMult(default: 3.0): multiplier of the main Supertrend.lenStart(default: 5) andlenStep(default: 1): first ATR length of the grid and increment between rows.multStart(default: 1.0) andmultStep(default: 0.1): first multiplier of the grid and increment between columns.metric(default: 0): 0 Win Rate, 1 Net Profit, 2 Profit Factor, 3 Total Trades, 4 Average Trade, 5 Reward/Risk Ratio, 6 Gross Profit, 7 Total Wins, 8 Win/Loss Ratio.xStep(default: 2): width of a grid cell, in bars.yStepPct(default: 2.0): depth of a grid cell, as a percentage of the price scale.zScalePct(default: 20.0): maximum height of the surface, as a percentage of the price scale.barOffset(default: 5): distance in bars between the last candle and the surface. A negative value such as -45 places the surface over the latest candles instead of the empty space on the right.viewBars(default: 150): number of bars used to size the surface vertically.showDash(default: 1): set to 0 to hide the dashboard.
Apply the indicator on the price chart. The surface is drawn to the right of the last candle: scroll the chart or widen the right margin to see it in full.
Code
//---------------------------------------------------------------
//PRC_Supertrend Parameter Sensitivity 3D
//version = 0
//23.09.26
//Iván González @ www.prorealcode.com
//Author: LuxAlgo
//Sharing ProRealTime knowledge
//--------------------------------------------------------------------//
// Apply it on the price chart.
defparam drawonlastbaronly = true

//----- Main indicator
autoApply = 0          // 1 = plot the most stable combination of the matrix
mainLen = 10           // ATR length of the main Supertrend
mainMult = 3.0         // multiplier of the main Supertrend

//----- Sensitivity ranges (10 lengths x 10 multipliers = 100 Supertrends)
lenStart = 5
lenStep = 1
multStart = 1.0
multStep = 0.1

//----- Optimization metric
// 0 Win Rate, 1 Net Profit, 2 Profit Factor, 3 Total Trades, 4 Average Trade,
// 5 Reward/Risk Ratio, 6 Gross Profit, 7 Total Wins, 8 Win/Loss Ratio
metric = 0

//----- 3D surface
xStep = 2              // width of a grid cell, in bars
yStepPct = 2.0         // depth of a grid cell, % of the price scale
zScalePct = 20.0       // max height of the surface peaks, % of the price scale
barOffset = 5          // bars between the last candle and the surface (negative = over the candles)
viewBars = 150         // lookback that sets the price scale of the surface
showDash = 1           // 1 = show the matrix dashboard (top right)

//----- Colors
rHi = 8
gHi = 153
bHi = 129
rLo = 242
gLo = 54
bLo = 69
rSt = 33
gSt = 150
bSt = 243

//---------------------------------------------------------------
// ATR of the 10 lengths of the matrix (Wilder)
//---------------------------------------------------------------
atr0 = averagetruerange[lenStart](close)
atr1 = averagetruerange[lenStart + 1 * lenStep](close)
atr2 = averagetruerange[lenStart + 2 * lenStep](close)
atr3 = averagetruerange[lenStart + 3 * lenStep](close)
atr4 = averagetruerange[lenStart + 4 * lenStep](close)
atr5 = averagetruerange[lenStart + 5 * lenStep](close)
atr6 = averagetruerange[lenStart + 6 * lenStep](close)
atr7 = averagetruerange[lenStart + 7 * lenStep](close)
atr8 = averagetruerange[lenStart + 8 * lenStep](close)
atr9 = averagetruerange[lenStart + 9 * lenStep](close)

$aNow[0] = atr0
$aNow[1] = atr1
$aNow[2] = atr2
$aNow[3] = atr3
$aNow[4] = atr4
$aNow[5] = atr5
$aNow[6] = atr6
$aNow[7] = atr7
$aNow[8] = atr8
$aNow[9] = atr9
$aPrev[0] = atr0[1]
$aPrev[1] = atr1[1]
$aPrev[2] = atr2[1]
$aPrev[3] = atr3[1]
$aPrev[4] = atr4[1]
$aPrev[5] = atr5[1]
$aPrev[6] = atr6[1]
$aPrev[7] = atr7[1]
$aPrev[8] = atr8[1]
$aPrev[9] = atr9[1]

//---------------------------------------------------------------
// State of the 100 Supertrends
// $c* = committed state, up to the last CLOSED bar.
// $t* = tentative state including the live bar, rebuilt on every tick
//       from the committed one, so ticks never add a trade twice
//       (arrays are NOT rewound between ticks the way scalars are).
//---------------------------------------------------------------
IF barindex = 0 THEN
   $gState[0] = 0 - 1
   FOR k = 0 TO 99 DO
      $cUp[k] = 0
      $cDn[k] = 0
      $cHas[k] = 0
      $cTrend[k] = 1
      $cTrades[k] = 0
      $cWins[k] = 0
      $cGP[k] = 0
      $cGL[k] = 0
      $cEntry[k] = 0
      $cPos[k] = 0
   NEXT
ENDIF

//----- Commit the last closed bar, once per bar
IF barindex > $gState[0] THEN
   $gState[0] = barindex
   IF barindex >= 2 THEN
      hlC = (high[1] + low[1]) / 2
      clC = close[1]
      clCP = close[2]
      FOR ci = 0 TO 9 DO
         lenC = lenStart + ci * lenStep
         IF barindex - 1 >= lenC - 1 THEN
            atrC = $aPrev[ci]
            FOR cj = 0 TO 9 DO
               k = ci * 10 + cj
               multC = multStart + cj * multStep
               bLoC = hlC - multC * atrC
               bUpC = hlC + multC * atrC
               IF $cHas[k] = 1 THEN
                  pLoC = $cUp[k]
                  pUpC = $cDn[k]
               ELSE
                  pLoC = bLoC
                  pUpC = bUpC
               ENDIF
               IF clCP > pLoC THEN
                  nLoC = max(bLoC, pLoC)
               ELSE
                  nLoC = bLoC
               ENDIF
               IF clCP < pUpC THEN
                  nUpC = min(bUpC, pUpC)
               ELSE
                  nUpC = bUpC
               ENDIF
               oldTrC = $cTrend[k]
               newTrC = oldTrC
               IF oldTrC = -1 AND clC > pUpC THEN
                  newTrC = 1
               ELSIF oldTrC = 1 AND clC < pLoC THEN
                  newTrC = -1
               ENDIF
               IF newTrC <> oldTrC THEN
                  IF $cPos[k] <> 0 THEN
                     pnlC = (clC - $cEntry[k]) / $cEntry[k] * $cPos[k] * 100
                     IF pnlC > 0 THEN
                        $cWins[k] = $cWins[k] + 1
                        $cGP[k] = $cGP[k] + pnlC
                     ELSE
                        $cGL[k] = $cGL[k] + abs(pnlC)
                     ENDIF
                     $cTrades[k] = $cTrades[k] + 1
                  ENDIF
                  $cPos[k] = newTrC
                  $cEntry[k] = clC
               ENDIF
               $cUp[k] = nLoC
               $cDn[k] = nUpC
               $cTrend[k] = newTrC
               $cHas[k] = 1
            NEXT
         ENDIF
      NEXT
   ENDIF
ENDIF

//----- Tentative state: committed state + the live bar (pure assignments)
hlT = (high + low) / 2
FOR ti = 0 TO 9 DO
   lenT = lenStart + ti * lenStep
   atrT = $aNow[ti]
   FOR tj = 0 TO 9 DO
      k = ti * 10 + tj
      tTrades = $cTrades[k]
      tWins = $cWins[k]
      tGP = $cGP[k]
      tGL = $cGL[k]
      IF barindex >= lenT - 1 AND barindex >= 1 THEN
         multT = multStart + tj * multStep
         bLoT = hlT - multT * atrT
         bUpT = hlT + multT * atrT
         IF $cHas[k] = 1 THEN
            pLoT = $cUp[k]
            pUpT = $cDn[k]
         ELSE
            pLoT = bLoT
            pUpT = bUpT
         ENDIF
         IF close[1] > pLoT THEN
            nLoT = max(bLoT, pLoT)
         ELSE
            nLoT = bLoT
         ENDIF
         IF close[1] < pUpT THEN
            nUpT = min(bUpT, pUpT)
         ELSE
            nUpT = bUpT
         ENDIF
         oldTrT = $cTrend[k]
         newTrT = oldTrT
         IF oldTrT = -1 AND close > pUpT THEN
            newTrT = 1
         ELSIF oldTrT = 1 AND close < pLoT THEN
            newTrT = -1
         ENDIF
         IF newTrT <> oldTrT AND $cPos[k] <> 0 THEN
            pnlT = (close - $cEntry[k]) / $cEntry[k] * $cPos[k] * 100
            IF pnlT > 0 THEN
               tWins = tWins + 1
               tGP = tGP + pnlT
            ELSE
               tGL = tGL + abs(pnlT)
            ENDIF
            tTrades = tTrades + 1
         ENDIF
         $tUp[k] = nLoT
         $tDn[k] = nUpT
         $tTrend[k] = newTrT
         $tHas[k] = 1
      ELSE
         $tUp[k] = $cUp[k]
         $tDn[k] = $cDn[k]
         $tTrend[k] = $cTrend[k]
         $tHas[k] = $cHas[k]
      ENDIF
      $tTrades[k] = tTrades
      $tWins[k] = tWins
      //----- metric of the combination
      zVal = 0
      tLoss = tTrades - tWins
      IF metric = 0 THEN
         IF tTrades > 0 THEN
            zVal = tWins / tTrades * 100
         ENDIF
      ELSIF metric = 1 THEN
         zVal = tGP - tGL
      ELSIF metric = 2 THEN
         IF tGL > 0 THEN
            zVal = tGP / tGL
         ELSIF tGP > 0 THEN
            zVal = 10
         ENDIF
      ELSIF metric = 3 THEN
         zVal = tTrades
      ELSIF metric = 4 THEN
         IF tTrades > 0 THEN
            zVal = (tGP - tGL) / tTrades
         ENDIF
      ELSIF metric = 5 THEN
         avgWin = 0
         IF tWins > 0 THEN
            avgWin = tGP / tWins
         ENDIF
         avgLoss = 0
         IF tLoss > 0 THEN
            avgLoss = tGL / tLoss
         ENDIF
         IF avgLoss > 0 THEN
            zVal = avgWin / avgLoss
         ELSIF avgWin > 0 THEN
            zVal = 10
         ENDIF
      ELSIF metric = 6 THEN
         zVal = tGP
      ELSIF metric = 7 THEN
         zVal = tWins
      ELSE
         IF tLoss > 0 THEN
            zVal = tWins / tLoss
         ELSIF tWins > 0 THEN
            zVal = 10
         ENDIF
      ENDIF
      $z[k] = zVal
   NEXT
NEXT

//---------------------------------------------------------------
// Most stable area: best (mean - 1.5 x deviation) over a full 3x3 window
//---------------------------------------------------------------
stI = 1
stJ = 1
stScore = 0
stFound = 0
FOR si = 1 TO 8 DO
   FOR sj = 1 TO 8 DO
      sumSc = 0
      FOR dio = -1 TO 1 DO
         FOR dj = -1 TO 1 DO
            sumSc = sumSc + $z[(si + dio) * 10 + sj + dj]
         NEXT
      NEXT
      avgSc = sumSc / 9
      devSum = 0
      FOR dio = -1 TO 1 DO
         FOR dj = -1 TO 1 DO
            dfz = $z[(si + dio) * 10 + sj + dj] - avgSc
            devSum = devSum + dfz * dfz
         NEXT
      NEXT
      combSc = avgSc - sqrt(devSum / 9) * 1.5
      IF stFound = 0 OR combSc > stScore THEN
         stScore = combSc
         stI = si
         stJ = sj
         stFound = 1
      ENDIF
   NEXT
NEXT

//---------------------------------------------------------------
// Main Supertrend (same recursion as the classic Supertrend)
//---------------------------------------------------------------
atrM = averagetruerange[mainLen](close)
hlM = (high + low) / 2
upBasic = hlM + mainMult * atrM
loBasic = hlM - mainMult * atrM
IF barindex <= mainLen THEN
   loBand = loBasic
   upBand = upBasic
   stDir = 1
   stLine = upBand
ELSE
   IF loBasic > loBand[1] OR close[1] < loBand[1] THEN
      loBand = loBasic
   ELSE
      loBand = loBand[1]
   ENDIF
   IF upBasic < upBand[1] OR close[1] > upBand[1] THEN
      upBand = upBasic
   ELSE
      upBand = upBand[1]
   ENDIF
   IF stLine[1] = upBand[1] THEN
      IF close > upBand THEN
         stDir = -1
      ELSE
         stDir = 1
      ENDIF
   ELSE
      IF close < loBand THEN
         stDir = 1
      ELSE
         stDir = -1
      ENDIF
   ENDIF
   IF stDir = -1 THEN
      stLine = loBand
   ELSE
      stLine = upBand
   ENDIF
ENDIF

upOn = 0
dnOn = 0
IF autoApply = 1 THEN
   kBest = stI * 10 + stJ
   IF $tHas[kBest] = 1 THEN
      IF $tTrend[kBest] = 1 THEN
         upOn = 1
         lineVal = $tUp[kBest]
      ELSE
         dnOn = 1
         lineVal = $tDn[kBest]
      ENDIF
   ENDIF
ELSIF barindex > mainLen THEN
   lineVal = stLine
   IF stDir < 0 THEN
      upOn = 1
   ELSE
      dnOn = 1
   ENDIF
ENDIF
IF upOn = 0 AND dnOn = 0 THEN
   lineVal = close
ENDIF
// both series carry the active value; the inactive one is hidden with alpha 0
upLine = lineVal
dnLine = lineVal
aUp = 255 * upOn
aDn = 255 * dnOn

//---------------------------------------------------------------
// 3D surface + dashboard, redrawn on the last bar
//---------------------------------------------------------------
basePrice = lowest[viewBars](low)
topPrice = highest[viewBars](high)

IF islastbarupdate THEN
   minZ = $z[0]
   maxZ = $z[0]
   bestV = $z[0]
   bestI = 0
   bestJ = 0
   worstV = $z[0]
   worstI = 0
   worstJ = 0
   FOR i = 0 TO 9 DO
      FOR j = 0 TO 9 DO
         v = $z[i * 10 + j]
         minZ = min(minZ, v)
         maxZ = max(maxZ, v)
         IF v >= bestV THEN
            bestV = v
            bestI = i
            bestJ = j
         ENDIF
         IF v <= worstV THEN
            worstV = v
            worstI = i
            worstJ = j
         ENDIF
      NEXT
   NEXT
   rangeZ = maxZ - minZ
   IF rangeZ = 0 THEN
      rangeZ = 1
   ENDIF

   priceRng = topPrice - basePrice
   IF priceRng = 0 THEN
      priceRng = close * 0.01
   ENDIF
   yStep = priceRng * yStepPct / 100
   zScale = priceRng * zScalePct / 100
   x0 = barindex + barOffset + 9 * xStep

   FOR i = 0 TO 9 DO
      FOR j = 0 TO 9 DO
         k = i * 10 + j
         $nz[k] = ($z[k] - minZ) / rangeZ
         $cx[k] = x0 + (i - j) * xStep
         $cy[k] = basePrice + (i + j) * yStep + $nz[k] * zScale
      NEXT
   NEXT

   //----- bounding box and axes
   xLeft = x0 - 9 * xStep
   yLeft = basePrice + 9 * yStep
   xRight = x0 + 9 * xStep
   yRight = basePrice + 9 * yStep
   xBack = x0
   yBack = basePrice + 18 * yStep

   DRAWSEGMENT(xLeft, yLeft, xBack, yBack) COLOURED(120, 123, 134, 102)
   DRAWSEGMENT(xRight, yRight, xBack, yBack) COLOURED(120, 123, 134, 102)
   DRAWSEGMENT(xLeft, yLeft + zScale, xBack, yBack + zScale) COLOURED(120, 123, 134, 102)
   DRAWSEGMENT(xRight, yRight + zScale, xBack, yBack + zScale) COLOURED(120, 123, 134, 102)
   DRAWSEGMENT(xLeft, yLeft, xLeft, yLeft + zScale) COLOURED(120, 123, 134, 102)
   DRAWSEGMENT(xRight, yRight, xRight, yRight + zScale) COLOURED(120, 123, 134, 102)
   DRAWSEGMENT(xBack, yBack, xBack, yBack + zScale) COLOURED(120, 123, 134, 102)
   FOR gk = 1 TO 4 DO
      zl = gk * zScale / 5
      DRAWSEGMENT(xLeft, yLeft + zl, xBack, yBack + zl) COLOURED(120, 123, 134, 179) STYLE(dottedline, 1)
      DRAWSEGMENT(xRight, yRight + zl, xBack, yBack + zl) COLOURED(120, 123, 134, 179) STYLE(dottedline, 1)
   NEXT

   //----- Z scale labels (left edge)
   maxZr = round(maxZ * 100) / 100
   midZr = round((minZ + rangeZ / 2) * 100) / 100
   minZr = round(minZ * 100) / 100
   xLbl = xLeft - 3
   DRAWTEXT("#maxZr#", xLbl, yLeft + zScale, SansSerif, Standard, 9) COLOURED(0, 0, 0, 255)
   DRAWTEXT("#midZr#", xLbl, yLeft + zScale / 2, SansSerif, Standard, 9) COLOURED(0, 0, 0, 255)
   DRAWTEXT("#minZr#", xLbl, yLeft, SansSerif, Standard, 9) COLOURED(0, 0, 0, 255)

   //----- axis titles
   lineH = priceRng * 0.025
   lenS0 = lenStart
   multS0 = multStart
   DRAWTEXT("Length (Y)", xLbl - 4, yLeft - lineH, SansSerif, Standard, 9) COLOURED(0, 0, 0, 255)
   DRAWTEXT("Len: #lenS0#", xLbl - 4, yLeft - 2 * lineH, SansSerif, Standard, 9) COLOURED(0, 0, 0, 255)
   DRAWTEXT("Multiplier (X)", xRight + 6, yRight, SansSerif, Standard, 9) COLOURED(0, 0, 0, 255)
   DRAWTEXT("Mult: #multS0#", xRight + 6, yRight - lineH, SansSerif, Standard, 9) COLOURED(0, 0, 0, 255)

   //----- cells, back to front (painter's algorithm)
   FOR j = 8 DOWNTO 0 DO
      FOR i = 8 DOWNTO 0 DO
         k1 = i * 10 + j
         k2 = (i + 1) * 10 + j
         k3 = i * 10 + j + 1
         k4 = (i + 1) * 10 + j + 1
         avgNz = ($nz[k1] + $nz[k2] + $nz[k3] + $nz[k4]) / 4
         cr = rLo + (rHi - rLo) * avgNz
         cg = gLo + (gHi - gLo) * avgNz
         cb = bLo + (bHi - bLo) * avgNz
         ca = 179
         isBestC = (i = bestI OR i + 1 = bestI) AND (j = bestJ OR j + 1 = bestJ)
         isStabC = (i = stI OR i + 1 = stI) AND (j = stJ OR j + 1 = stJ)
         IF isBestC THEN
            cr = 255
            cg = 215
            cb = 0
            ca = 204
         ELSIF isStabC THEN
            cr = rSt
            cg = gSt
            cb = bSt
            ca = 204
         ENDIF
         // the cell is the quad P1-P2-P4-P3, filled as two triangles
         DRAWTRIANGLE($cx[k1], $cy[k1], $cx[k2], $cy[k2], $cx[k4], $cy[k4]) COLOURED(cr, cg, cb, 0) FILLCOLOR(cr, cg, cb, ca)
         DRAWTRIANGLE($cx[k1], $cy[k1], $cx[k4], $cy[k4], $cx[k3], $cy[k3]) COLOURED(cr, cg, cb, 0) FILLCOLOR(cr, cg, cb, ca)
         DRAWSEGMENT($cx[k1], $cy[k1], $cx[k2], $cy[k2]) COLOURED(120, 123, 134, 128)
         DRAWSEGMENT($cx[k3], $cy[k3], $cx[k4], $cy[k4]) COLOURED(120, 123, 134, 128)
         DRAWSEGMENT($cx[k1], $cy[k1], $cx[k3], $cy[k3]) COLOURED(120, 123, 134, 128)
         DRAWSEGMENT($cx[k2], $cy[k2], $cx[k4], $cy[k4]) COLOURED(120, 123, 134, 128)
      NEXT
   NEXT

   //----- best point
   kB = bestI * 10 + bestJ
   bestVr = round(bestV * 100) / 100
   bestLen = lenStart + bestI * lenStep
   bestMult = round((multStart + bestJ * multStep) * 100) / 100
   DRAWTEXT("↓", $cx[kB], $cy[kB] + lineH, SansSerif, Bold, 12) COLOURED(0, 0, 0, 255)
   DRAWTEXT("Len: #bestLen# | Mult: #bestMult#", $cx[kB], $cy[kB] + 2 * lineH, SansSerif, Standard, 10) COLOURED(0, 0, 0, 255)
   DRAWTEXT("Val: #bestVr#", $cx[kB], $cy[kB] + 3 * lineH, SansSerif, Standard, 10) COLOURED(0, 0, 0, 255)

   //----- stable point
   IF stI <> bestI OR stJ <> bestJ THEN
      kS = stI * 10 + stJ
      stVr = round($z[kS] * 100) / 100
      stLen = lenStart + stI * lenStep
      stMult = round((multStart + stJ * multStep) * 100) / 100
      DRAWTEXT("↓", $cx[kS], $cy[kS] + lineH, SansSerif, Bold, 12) COLOURED(0, 0, 0, 255)
      DRAWTEXT("Len: #stLen# | Mult: #stMult#", $cx[kS], $cy[kS] + 2 * lineH, SansSerif, Standard, 10) COLOURED(0, 0, 0, 255)
      DRAWTEXT("Stable: #stVr#", $cx[kS], $cy[kS] + 3 * lineH, SansSerif, Standard, 10) COLOURED(0, 0, 0, 255)
   ENDIF

   //----- info label
   yInfo = yBack + zScale + priceRng * 0.05
   IF metric = 0 THEN
      DRAWTEXT("Z-Axis Metric: Win Rate", xLeft, yInfo + lineH, SansSerif, Standard, 10) COLOURED(0, 0, 0, 255)
   ELSIF metric = 1 THEN
      DRAWTEXT("Z-Axis Metric: Net Profit", xLeft, yInfo + lineH, SansSerif, Standard, 10) COLOURED(0, 0, 0, 255)
   ELSIF metric = 2 THEN
      DRAWTEXT("Z-Axis Metric: Profit Factor", xLeft, yInfo + lineH, SansSerif, Standard, 10) COLOURED(0, 0, 0, 255)
   ELSIF metric = 3 THEN
      DRAWTEXT("Z-Axis Metric: Total Trades", xLeft, yInfo + lineH, SansSerif, Standard, 10) COLOURED(0, 0, 0, 255)
   ELSIF metric = 4 THEN
      DRAWTEXT("Z-Axis Metric: Average Trade", xLeft, yInfo + lineH, SansSerif, Standard, 10) COLOURED(0, 0, 0, 255)
   ELSIF metric = 5 THEN
      DRAWTEXT("Z-Axis Metric: Reward/Risk Ratio", xLeft, yInfo + lineH, SansSerif, Standard, 10) COLOURED(0, 0, 0, 255)
   ELSIF metric = 6 THEN
      DRAWTEXT("Z-Axis Metric: Gross Profit", xLeft, yInfo + lineH, SansSerif, Standard, 10) COLOURED(0, 0, 0, 255)
   ELSIF metric = 7 THEN
      DRAWTEXT("Z-Axis Metric: Total Wins", xLeft, yInfo + lineH, SansSerif, Standard, 10) COLOURED(0, 0, 0, 255)
   ELSE
      DRAWTEXT("Z-Axis Metric: Win/Loss Ratio", xLeft, yInfo + lineH, SansSerif, Standard, 10) COLOURED(0, 0, 0, 255)
   ENDIF
   DRAWTEXT("Range: #minZr# to #maxZr#", xLeft, yInfo, SansSerif, Standard, 10) COLOURED(0, 0, 0, 255)

   //---------------------------------------------------------------
   // Dashboard: value distribution + 10x10 matrix (anchored top right)
   //---------------------------------------------------------------
   IF showDash = 1 THEN
      colW = 48
      rowH = 18
      tblR = -90
      tblL = tblR - 11 * colW
      tblB = -72 - 11 * rowH
      DRAWRECTANGLE(tblL, -6, tblR, tblB) ANCHOR(TOPRIGHT, XSHIFT, YSHIFT) COLOURED(46, 46, 46, 255) FILLCOLOR(22, 22, 22, 255)

      //----- value distribution (25 bins)
      FOR b = 0 TO 24 DO
         $bins[b] = 0
      NEXT
      sumAll = 0
      FOR k = 0 TO 99 DO
         v = $z[k]
         sumAll = sumAll + v
         bIdx = floor((v - minZ) / rangeZ * 24.99)
         bIdx = max(0, min(24, bIdx))
         $bins[bIdx] = $bins[bIdx] + 1
      NEXT
      avgAll = sumAll / 100
      maxBin = 0
      FOR b = 0 TO 24 DO
         maxBin = max(maxBin, $bins[b])
      NEXT
      avgBin = floor((avgAll - minZ) / rangeZ * 24.99)
      avgBin = max(0, min(24, avgBin))
      avgAllr = round(avgAll * 100) / 100
      xMid = (tblL + tblR) / 2
      DRAWTEXT("Value Distribution (Avg: #avgAllr#)", xMid, -16, SansSerif, Standard, 10) ANCHOR(TOPRIGHT, XSHIFT, YSHIFT) COLOURED(255, 255, 255, 255)
      FOR b = 0 TO 24 DO
         xb = xMid + (b - 12) * 11
         IF b = avgBin THEN
            DRAWTEXT("┃", xb, -34, Monospaced, Standard, 11) ANCHOR(TOPRIGHT, XSHIFT, YSHIFT) COLOURED(255, 255, 255, 255)
            DRAWTEXT("▲", xb, -50, Monospaced, Standard, 9) ANCHOR(TOPRIGHT, XSHIFT, YSHIFT) COLOURED(255, 255, 255, 255)
         ELSE
            blk = 0
            IF maxBin > 0 THEN
               blk = round($bins[b] / maxBin * 7)
            ENDIF
            IF blk = 1 THEN
               DRAWTEXT("▂", xb, -34, Monospaced, Standard, 11) ANCHOR(TOPRIGHT, XSHIFT, YSHIFT) COLOURED(255, 255, 255, 255)
            ELSIF blk = 2 THEN
               DRAWTEXT("▃", xb, -34, Monospaced, Standard, 11) ANCHOR(TOPRIGHT, XSHIFT, YSHIFT) COLOURED(255, 255, 255, 255)
            ELSIF blk = 3 THEN
               DRAWTEXT("▄", xb, -34, Monospaced, Standard, 11) ANCHOR(TOPRIGHT, XSHIFT, YSHIFT) COLOURED(255, 255, 255, 255)
            ELSIF blk = 4 THEN
               DRAWTEXT("▅", xb, -34, Monospaced, Standard, 11) ANCHOR(TOPRIGHT, XSHIFT, YSHIFT) COLOURED(255, 255, 255, 255)
            ELSIF blk = 5 THEN
               DRAWTEXT("▆", xb, -34, Monospaced, Standard, 11) ANCHOR(TOPRIGHT, XSHIFT, YSHIFT) COLOURED(255, 255, 255, 255)
            ELSIF blk = 6 THEN
               DRAWTEXT("▇", xb, -34, Monospaced, Standard, 11) ANCHOR(TOPRIGHT, XSHIFT, YSHIFT) COLOURED(255, 255, 255, 255)
            ELSIF blk = 7 THEN
               DRAWTEXT("█", xb, -34, Monospaced, Standard, 11) ANCHOR(TOPRIGHT, XSHIFT, YSHIFT) COLOURED(255, 255, 255, 255)
            ENDIF
         ENDIF
      NEXT
      DRAWSEGMENT(tblL + 4, -64, tblR - 4, -64) ANCHOR(TOPRIGHT, XSHIFT, YSHIFT) COLOURED(46, 46, 46, 255)

      //----- header row
      yH = -72 - rowH / 2
      DRAWTEXT("Len / Mult", tblL + colW / 2, yH, SansSerif, Standard, 8) ANCHOR(TOPRIGHT, XSHIFT, YSHIFT) COLOURED(128, 128, 128, 255)
      FOR j = 0 TO 9 DO
         mHead = round((multStart + j * multStep) * 10) / 10
         DRAWTEXT("#mHead#", tblL + (j + 1) * colW + colW / 2, yH, SansSerif, Standard, 9) ANCHOR(TOPRIGHT, XSHIFT, YSHIFT) COLOURED(128, 128, 128, 255)
      NEXT

      //----- matrix rows
      FOR i = 0 TO 9 DO
         yTop = -72 - (i + 1) * rowH
         yC = yTop - rowH / 2
         lHead = lenStart + i * lenStep
         DRAWTEXT("#lHead#", tblL + colW / 2, yC, SansSerif, Standard, 9) ANCHOR(TOPRIGHT, XSHIFT, YSHIFT) COLOURED(128, 128, 128, 255)
         FOR j = 0 TO 9 DO
            k = i * 10 + j
            nv = $nz[k]
            br = rLo + (rHi - rLo) * nv
            bg = gLo + (gHi - gLo) * nv
            bb = bLo + (bHi - bLo) * nv
            xc1 = tblL + (j + 1) * colW
            DRAWRECTANGLE(xc1, yTop, xc1 + colW, yTop - rowH) ANCHOR(TOPRIGHT, XSHIFT, YSHIFT) COLOURED(46, 46, 46, 255) FILLCOLOR(br, bg, bb, 255)
            cellV = round($z[k] * 100) / 100
            xcT = xc1 + colW / 2 + 5
            IF i = stI AND j = stJ AND (stI <> bestI OR stJ <> bestJ) THEN
               DRAWTEXT("#cellV#", xcT, yC, SansSerif, Standard, 8) ANCHOR(TOPRIGHT, XSHIFT, YSHIFT) COLOURED(rSt, gSt, bSt, 255)
            ELSE
               DRAWTEXT("#cellV#", xcT, yC, SansSerif, Standard, 8) ANCHOR(TOPRIGHT, XSHIFT, YSHIFT) COLOURED(255, 255, 255, 255)
            ENDIF
            IF i = bestI AND j = bestJ THEN
               DRAWTEXT("★", xc1 + 7, yC, SansSerif, Standard, 8) ANCHOR(TOPRIGHT, XSHIFT, YSHIFT) COLOURED(255, 255, 255, 255)
            ELSIF i = worstI AND j = worstJ THEN
               DRAWTEXT("✖", xc1 + 7, yC, SansSerif, Standard, 8) ANCHOR(TOPRIGHT, XSHIFT, YSHIFT) COLOURED(255, 255, 255, 255)
            ELSIF i = stI AND j = stJ THEN
               DRAWTEXT("♦", xc1 + 7, yC, SansSerif, Standard, 8) ANCHOR(TOPRIGHT, XSHIFT, YSHIFT) COLOURED(255, 255, 255, 255)
            ENDIF
         NEXT
      NEXT
   ENDIF
ENDIF

RETURN upLine COLOURED(8, 153, 129, aUp) AS "Up Trend", dnLine COLOURED(242, 54, 69, aDn) AS "Down Trend"
Conclusion
A single optimised parameter set says very little about how much you can trust it. This indicator shows the whole neighbourhood: where the good results are, how wide that area is, and which combination sits in its most stable part. It turns Supertrend tuning from picking a number into reading a landscape.