





Smart Money Absorption Radar: Volume Absorption, Liquidity Sweeps and Targets
Introduction
When a large participant wants to buy without chasing price, it lets sellers hit its orders. The footprint on a normal candle chart is a bar with heavy volume, a long lower wick and a close near the high: sellers pushed, the volume was absorbed, and price came back up. The same picture upside down shows sellers absorbing buying pressure.
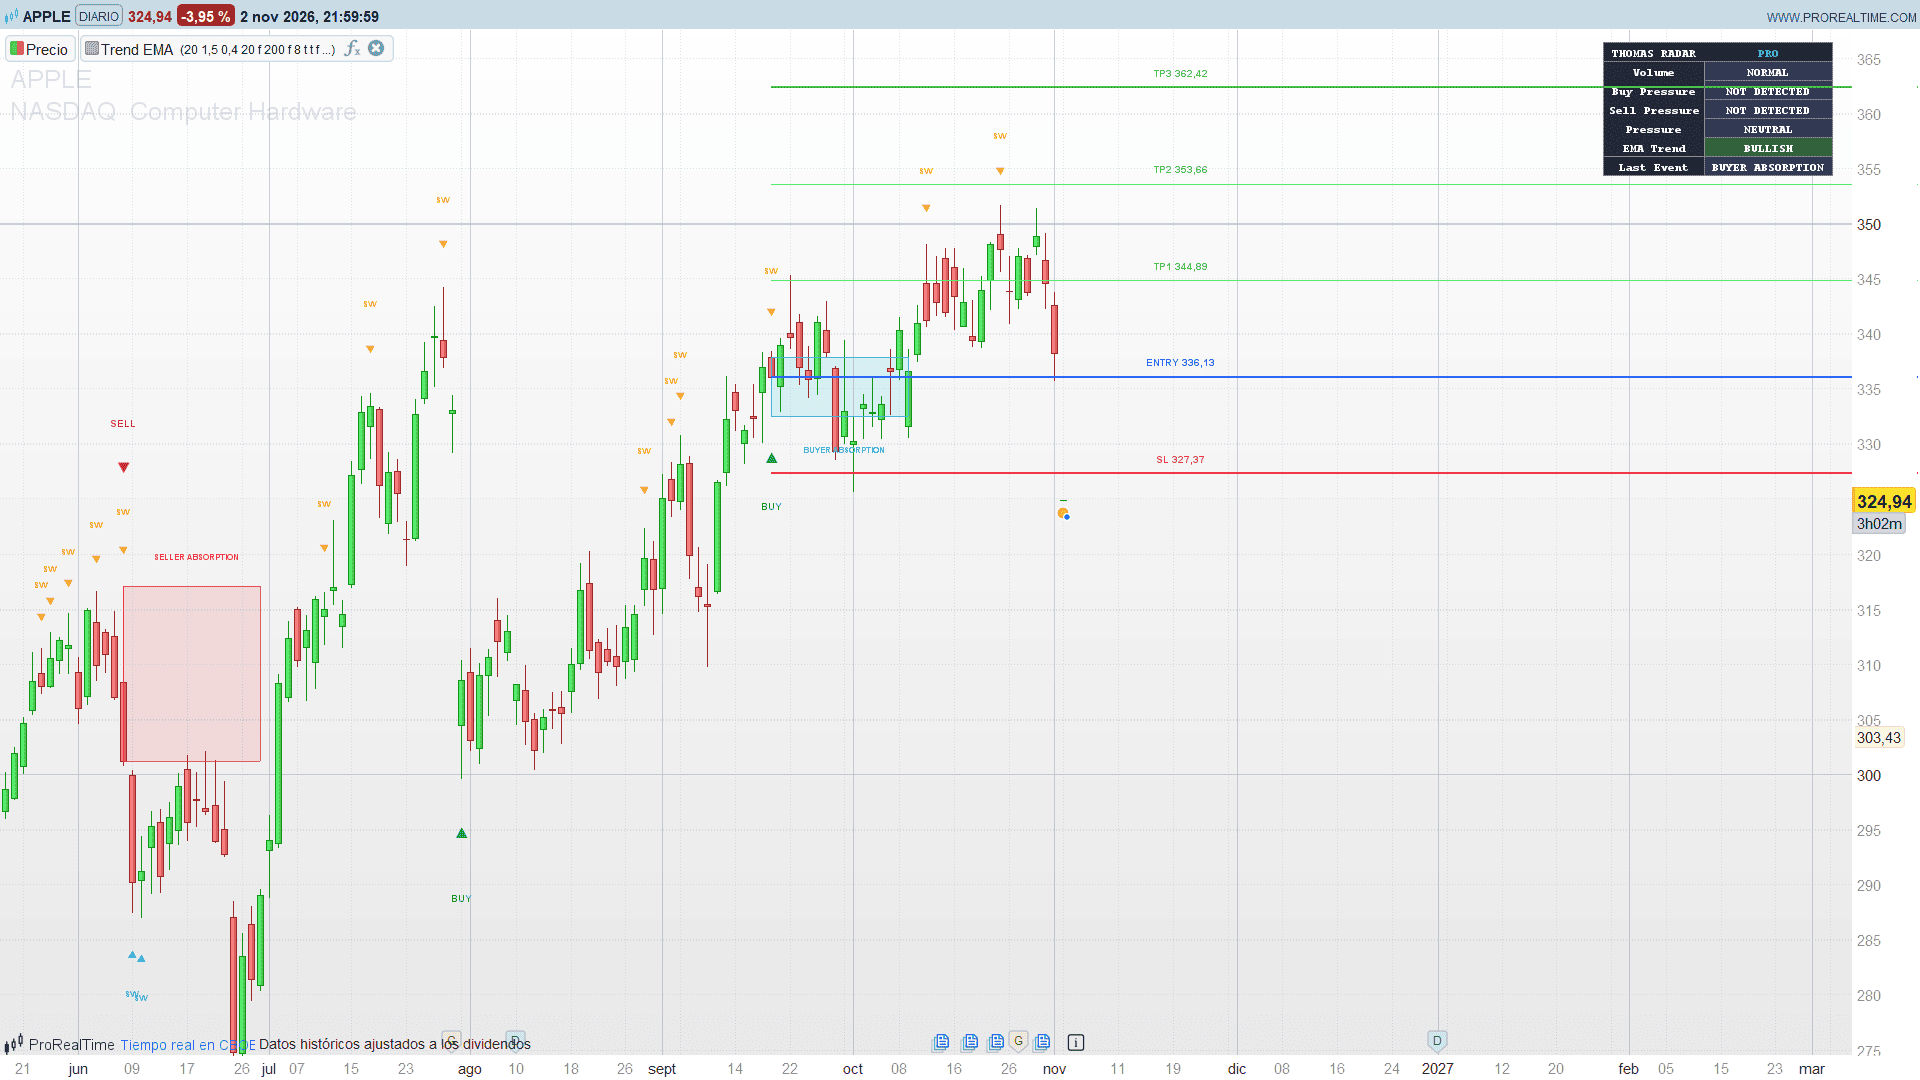
The Smart Money Absorption Radar by Thomas-Sterling turns that idea into a complete toolkit on the price chart: absorption signals, liquidity sweeps of recent highs and lows, an absorption zone for the last signal of each side, automatic stop and target levels, and a small “radar” dashboard that sums up the current state of the market.
Theory Behind the Indicator
Volume spike. A bar is a spike when its volume is at least 1.5 times its 20-bar simple average.
Rejection. Each bar is measured against its own range. A bullish rejection needs a lower wick of at least 40 % of the range and a close in the top 40 % of the bar (close position 0.60 or more). A bearish rejection needs an upper wick of at least 40 % and a close in the bottom 40 %.
Absorption. Volume spike plus rejection. Heavy volume that does not move price in its direction is read as passive orders absorbing the aggressive side.
Liquidity sweep. The bar takes out the lowest low of the previous 20 bars and closes back above it (bullish sweep), or takes out the highest high and closes back below it (bearish sweep). Stops resting beyond the range are triggered and price is rejected.
Filters and cooldown. A BUY or SELL is an absorption bar that passes the optional filters: close above the 200 EMA for buys and below it for sells, and a liquidity sweep on the same bar. After a signal, no new signal is given for 8 bars. Signals are only given on closed bars.
Auto targets. At each signal the entry is the close, the stop is placed 1.5 ATR(14) away, and TP1, TP2 and TP3 sit at 1, 2 and 3 times that risk.
Key Features at a Glance
- BUY and SELL absorption signals on closed bars, with a configurable cooldown.
- Liquidity sweep marks (SW) for both sides.
- Optional EMA trend filter and optional sweep requirement.
- Absorption zone of the last buy signal and of the last sell signal, extended to the right.
- Entry, stop and three targets of the last signal, with price labels and lines extended to the right.
- “THOMAS RADAR” dashboard: volume state, buy and sell pressure of the current bar, net pressure, EMA trend and last event.
How to Read the Indicator
- Green BUY with an up triangle below the bar: buyer absorption confirmed. The aqua box from the body low to the wick low is the zone where the selling was absorbed.
- Red SELL with a down triangle above the bar: seller absorption confirmed. The red box covers the upper wick.
- SW triangles: liquidity sweeps. Aqua below the bar for a bullish sweep, orange above the bar for a bearish one.
- Blue line: entry of the last signal. Red line: stop. Green lines: TP1, TP2 and TP3.
- Dashboard: HIGH VOLUME in orange when the current bar is a spike; DETECTED in green or red when the current bar is an absorption candidate (before any filter or cooldown); Last Event keeps the last confirmed signal.
Practical Applications
- Reversal entries at the edge of a range: enable “Require Liquidity Sweep” to keep only the absorptions that also sweep the 20-bar high or low.
- With-trend pullbacks: enable the EMA filter to take only buy absorptions above the 200 EMA and sell absorptions below it.
- Trade planning: the auto targets give a ready-made plan with a fixed risk in ATR and three reward multiples to scale out.
- Context reading: the absorption zone often acts as support (buyer zone) or resistance (seller zone) on a later retest.
The detection is based on price and volume only, not on bid/ask order flow, so it is an estimate of absorption. It needs a market with real volume: on instruments without volume the volume spike never triggers.
Indicator Configuration
- volLength (default 20): length of the volume average.
- volMultiplier (default 1.5): volume spike threshold, as a multiple of the average.
- wickRatio (default 0.40): minimum rejection wick, as a fraction of the bar range.
- rangeLength (default 20): lookback of the liquidity sweep.
- useTrendFilter (default 0): 1 = buy only above the EMA and sell only below it.
- emaLength (default 200): length of the trend EMA.
- useSweepFilter (default 0): 1 = require a liquidity sweep on the signal bar.
- cooldown (default 8): minimum number of bars between two signals.
- showZones (default 1): show the absorption zones.
- showSweep (default 1): show the liquidity sweep marks.
- showEMA (default 0): show the trend EMA.
- showSignals (default 1): show the BUY / SELL signals.
- zoneExtension (default 20): length of the absorption zones, in bars.
- showDashboard (default 1): show the radar dashboard.
- showTargets (default 1): show entry, stop and targets of the last signal.
- targetATR (default 1.5): stop distance, in ATR(14).
- targetRR1 / targetRR2 / targetRR3 (default 1 / 2 / 3): risk/reward of the three targets.
- targetExtension (default 20): distance, in bars, between the signal and the price labels.
The Code
//---------------------------------------------------------------
// PRC_SM Absorption Radar
// version = 0
// 03.11.2026
// Iván González @ www.prorealcode.com
// Author: Thomas-Sterling
// Sharing ProRealTime knowledge
//--------------------------------------------------------------------//
DEFPARAM DRAWONLASTBARONLY = true

// ===================== INPUTS: ABSORPTION ENGINE =====================
volLength = 20         // volume average length (min 5)
volMultiplier = 1.5    // volume spike multiplier (min 1.0)
wickRatio = 0.40       // minimum rejection wick ratio (0.1 - 0.9)
rangeLength = 20       // liquidity lookback (min 5)

// ===================== INPUTS: SIGNAL FILTERS =====================
useTrendFilter = 0     // 1 = only buy above the EMA / sell below it
emaLength = 200        // EMA length (min 20)
useSweepFilter = 0     // 1 = require a liquidity sweep on the signal bar
cooldown = 8           // signal cooldown, in bars

// ===================== INPUTS: CHART VISUALS =====================
showZones = 1          // 1 = show the absorption zones
showSweep = 1          // 1 = show the liquidity sweeps
showEMA = 0            // 1 = show the EMA
showSignals = 1        // 1 = show the BUY / SELL signals
zoneExtension = 20     // zone length, in bars (1 - 200)

// ===================== INPUTS: RADAR DASHBOARD =====================
showDashboard = 1      // 1 = show the dashboard (top right corner)

// ===================== INPUTS: AUTO TARGETS =====================
showTargets = 1        // 1 = show entry, stop and targets of the last signal
targetATR = 1.5        // stop loss distance, in ATR(14)
targetRR1 = 1.0        // TP1 risk/reward
targetRR2 = 2.0        // TP2 risk/reward
targetRR3 = 3.0        // TP3 risk/reward
targetExtension = 20   // bars between the signal and the price labels (5 - 200)

// ===================== VOLUME AND PRICE ANALYSIS =====================
tk = ticksize
IF tk <= 0 THEN
   tk = 0.01
ENDIF
IF barindex >= 14 THEN
   myAtr = averagetruerange[14](close)
ELSE
   myAtr = high - low
ENDIF
myEma = average[emaLength, 1](close)
avgVolume = average[volLength](volume)

volumeSpike = 0
IF barindex >= volLength - 1 AND avgVolume > 0 THEN
   IF volume >= avgVolume * volMultiplier THEN
      volumeSpike = 1
   ENDIF
ENDIF

candleRange = max(high - low, tk)
upperWick = high - max(open, close)
lowerWick = min(open, close) - low
upperWickRatio = upperWick / candleRange
lowerWickRatio = lowerWick / candleRange
closePosition = (close - low) / candleRange

bullRejection = 0
IF lowerWickRatio >= wickRatio AND closePosition >= 0.60 THEN
   bullRejection = 1
ENDIF
bearRejection = 0
IF upperWickRatio >= wickRatio AND closePosition <= 0.40 THEN
   bearRejection = 1
ENDIF

// ===================== LIQUIDITY SWEEP ENGINE =====================
// lowest low / highest high of the previous rangeLength bars
bullSweep = 0
bearSweep = 0
IF barindex >= rangeLength THEN
   previousLow = lowest[rangeLength](low[1])
   previousHigh = highest[rangeLength](high[1])
   IF low < previousLow AND close > previousLow THEN
      bullSweep = 1
   ENDIF
   IF high > previousHigh AND close < previousHigh THEN
      bearSweep = 1
   ENDIF
ENDIF

// the live bar is the only bar that is not closed yet
barConfirmed = 1
IF islastbarupdate THEN
   barConfirmed = 0
ENDIF

// ===================== ABSORPTION DETECTION =====================
// estimated price-volume absorption (no bid/ask order flow involved)
bullAbsorption = volumeSpike * bullRejection
bearAbsorption = volumeSpike * bearRejection

emaReady = 0
IF barindex >= emaLength - 1 THEN
   emaReady = 1
ENDIF
trendBull = 1
trendBear = 1
IF useTrendFilter = 1 THEN
   IF NOT (emaReady = 1 AND close > myEma) THEN
      trendBull = 0
   ENDIF
   IF NOT (emaReady = 1 AND close < myEma) THEN
      trendBear = 0
   ENDIF
ENDIF
sweepBullValid = 1
sweepBearValid = 1
IF useSweepFilter = 1 THEN
   sweepBullValid = bullSweep
   sweepBearValid = bearSweep
ENDIF

rawBuy = bullAbsorption * trendBull * sweepBullValid
rawSell = bearAbsorption * trendBear * sweepBearValid

// ===================== SIGNAL COOLDOWN =====================
once hasSignal = 0
once lastSignalBar = 0
cooldownPassed = 0
IF hasSignal = 0 THEN
   cooldownPassed = 1
ELSIF barindex - lastSignalBar > cooldown THEN
   cooldownPassed = 1
ENDIF

buySignal = 0
sellSignal = 0
IF rawBuy = 1 AND cooldownPassed = 1 AND barConfirmed = 1 THEN
   buySignal = 1
ENDIF
IF rawSell = 1 AND cooldownPassed = 1 AND barConfirmed = 1 THEN
   sellSignal = 1
ENDIF
IF buySignal = 1 OR sellSignal = 1 THEN
   hasSignal = 1
   lastSignalBar = barindex
ENDIF

// ===================== ABSORPTION ZONES (only the last of each side) =====================
once hasBullZone = 0
once hasBearZone = 0
IF showZones = 1 AND buySignal = 1 THEN
   hasBullZone = 1
   bullZX = barindex
   bullZTop = max(open, close)
   bullZBot = low
   bullZOff = myAtr
ENDIF
IF showZones = 1 AND sellSignal = 1 THEN
   hasBearZone = 1
   bearZX = barindex
   bearZTop = high
   bearZBot = min(open, close)
   bearZOff = myAtr
ENDIF

// ===================== LAST EVENT =====================
// 0 = waiting, 1 = buyer absorption, 2 = seller absorption
once lastEvent = 0
IF buySignal = 1 THEN
   lastEvent = 1
ENDIF
IF sellSignal = 1 THEN
   lastEvent = 2
ENDIF

// ===================== AUTO TARGETS (only the last signal) =====================
once hasTargets = 0
IF buySignal = 1 OR sellSignal = 1 THEN
   autoEntry = close
   riskDistance = max(myAtr * targetATR, tk)
   IF buySignal = 1 THEN
      autoSL = autoEntry - riskDistance
      autoTP1 = autoEntry + riskDistance * targetRR1
      autoTP2 = autoEntry + riskDistance * targetRR2
      autoTP3 = autoEntry + riskDistance * targetRR3
   ELSE
      autoSL = autoEntry + riskDistance
      autoTP1 = autoEntry - riskDistance * targetRR1
      autoTP2 = autoEntry - riskDistance * targetRR2
      autoTP3 = autoEntry - riskDistance * targetRR3
   ENDIF
   // the original deletes the previous lines and only redraws when the targets are on
   hasTargets = showTargets
   tgX = barindex
ENDIF

// ===================== SIGNAL AND SWEEP MARKS =====================
// stored with a pure assignment indexed by a scalar counter (the counter
// rewinds between ticks, so nothing is left behind) and redrawn on the last bar
// type: 1 = BUY, 2 = SELL, 3 = bullish sweep, 4 = bearish sweep
once nMk = 0
IF showSweep = 1 AND bullSweep = 1 AND barConfirmed = 1 THEN
   $mkX[nMk] = barindex
   $mkT[nMk] = 3
   $mkY1[nMk] = low - 0.5 * myAtr
   $mkY2[nMk] = low - 1.0 * myAtr
   nMk = nMk + 1
ENDIF
IF showSweep = 1 AND bearSweep = 1 AND barConfirmed = 1 THEN
   $mkX[nMk] = barindex
   $mkT[nMk] = 4
   $mkY1[nMk] = high + 0.5 * myAtr
   $mkY2[nMk] = high + 1.0 * myAtr
   nMk = nMk + 1
ENDIF
// a BUY / SELL on a sweep bar goes below / above the sweep mark
IF showSweep = 1 AND bullSweep = 1 THEN
   buyShift = 1.1 * myAtr
ELSE
   buyShift = 0
ENDIF
IF showSweep = 1 AND bearSweep = 1 THEN
   sellShift = 1.1 * myAtr
ELSE
   sellShift = 0
ENDIF
IF showSignals = 1 AND buySignal = 1 THEN
   $mkX[nMk] = barindex
   $mkT[nMk] = 1
   $mkY1[nMk] = low - 0.5 * myAtr - buyShift
   $mkY2[nMk] = low - 1.1 * myAtr - buyShift
   nMk = nMk + 1
ENDIF
IF showSignals = 1 AND sellSignal = 1 THEN
   $mkX[nMk] = barindex
   $mkT[nMk] = 2
   $mkY1[nMk] = high + 0.5 * myAtr + sellShift
   $mkY2[nMk] = high + 1.1 * myAtr + sellShift
   nMk = nMk + 1
ENDIF

// ===================== EMA LINE =====================
IF showEMA = 1 AND emaReady = 1 THEN
   emaA = 255
ELSE
   emaA = 0
ENDIF

// ===================== DRAWING =====================
IF islastbarupdate THEN
   // ---------- signals and sweeps ----------
   IF nMk > 0 THEN
      FOR k = 0 TO nMk - 1 DO
         mx = $mkX[k]
         my1 = $mkY1[k]
         my2 = $mkY2[k]
         IF $mkT[k] = 1 THEN
            DRAWTEXT("▲", mx, my1, dialog, bold, 14) COLOURED(0, 150, 120, 255)
            DRAWTEXT("BUY", mx, my2, dialog, bold, 10) COLOURED(0, 150, 120, 255)
         ELSIF $mkT[k] = 2 THEN
            DRAWTEXT("▼", mx, my1, dialog, bold, 14) COLOURED(200, 55, 65, 255)
            DRAWTEXT("SELL", mx, my2, dialog, bold, 10) COLOURED(200, 55, 65, 255)
         ELSIF $mkT[k] = 3 THEN
            DRAWTEXT("▲", mx, my1, dialog, bold, 10) COLOURED(0, 188, 212, 255)
            DRAWTEXT("SW", mx, my2, dialog, bold, 8) COLOURED(0, 188, 212, 255)
         ELSE
            DRAWTEXT("▼", mx, my1, dialog, bold, 10) COLOURED(255, 152, 0, 255)
            DRAWTEXT("SW", mx, my2, dialog, bold, 8) COLOURED(255, 152, 0, 255)
         ENDIF
      NEXT
   ENDIF

   // ---------- absorption zones ----------
   // the caption goes outside the box, away from the candles: a text inside a box
   // overflows it as soon as the chart is zoomed out
   IF showZones = 1 AND hasBullZone = 1 THEN
      DRAWRECTANGLE(bullZX, bullZTop, bullZX + zoneExtension, bullZBot) COLOURED(0, 188, 212, 217) FILLCOLOR(0, 188, 212, 33)
      DRAWTEXT("BUYER ABSORPTION", bullZX + zoneExtension / 2, bullZBot - 0.4 * bullZOff, dialog, bold, 8) COLOURED(0, 188, 212, 255)
   ENDIF
   IF showZones = 1 AND hasBearZone = 1 THEN
      DRAWRECTANGLE(bearZX, bearZTop, bearZX + zoneExtension, bearZBot) COLOURED(242, 54, 69, 217) FILLCOLOR(242, 54, 69, 33)
      DRAWTEXT("SELLER ABSORPTION", bearZX + zoneExtension / 2, bearZTop + 0.4 * bearZOff, dialog, bold, 8) COLOURED(242, 54, 69, 255)
   ENDIF

   // ---------- auto targets ----------
   IF hasTargets = 1 THEN
      pE = round(autoEntry / tk) * tk
      pSL = round(autoSL / tk) * tk
      pT1 = round(autoTP1 / tk) * tk
      pT2 = round(autoTP2 / tk) * tk
      pT3 = round(autoTP3 / tk) * tk
      tgX2 = tgX + targetExtension
      // the lines extend to the right, as in the original
      DRAWRAY(tgX, autoEntry, tgX2, autoEntry) COLOURED(41, 98, 255, 255) STYLE(line, 2)
      DRAWRAY(tgX, autoSL, tgX2, autoSL) COLOURED(242, 54, 69, 255) STYLE(line, 2)
      DRAWRAY(tgX, autoTP1, tgX2, autoTP1) COLOURED(0, 230, 118, 255) STYLE(line, 1)
      DRAWRAY(tgX, autoTP2, tgX2, autoTP2) COLOURED(0, 230, 118, 255) STYLE(line, 1)
      DRAWRAY(tgX, autoTP3, tgX2, autoTP3) COLOURED(76, 175, 80, 255) STYLE(line, 2)
      // DRAWTEXT is centred on x: shifted right so the label starts at the end bar
      lbX = tgX2 + 5
      DRAWTEXT("ENTRY #pE#", lbX, autoEntry, dialog, bold, 10) COLOURED(41, 98, 255, 255)
      DRAWTEXT("SL #pSL#", lbX, autoSL, dialog, bold, 10) COLOURED(242, 54, 69, 255)
      DRAWTEXT("TP1 #pT1#", lbX, autoTP1, dialog, bold, 10) COLOURED(76, 175, 80, 255)
      DRAWTEXT("TP2 #pT2#", lbX, autoTP2, dialog, bold, 10) COLOURED(76, 175, 80, 255)
      DRAWTEXT("TP3 #pT3#", lbX, autoTP3, dialog, bold, 10) COLOURED(76, 175, 80, 255)
   ENDIF

   // ---------- radar dashboard ----------
   IF showDashboard = 1 THEN
      // geometry: monospaced bold, every character is chW pixels wide
      pz = 11
      chW = pz * 0.62
      rowH = pz + 8
      padX = 6
      col0W = 13 * chW + 2 * padX
      col1W = 17 * chW + 2 * padX
      pW = col0W + col1W
      pH = 7 * rowH
      pL = 0 - 85 - pW
      pT = 0 - 12
      xM = pL + col0W
      xC0 = pL + col0W / 2
      xC1 = xM + col1W / 2
      // cell colours: the original greys are transparent over a dark chart, so they
      // are drawn opaque (a transparent dark table turns grey on a light chart)
      IF volumeSpike = 1 THEN
         vR = 184
         vG = 113
         vB = 10
      ELSE
         vR = 54
         vG = 58
         vB = 69
      ENDIF
      IF bullAbsorption = 1 THEN
         bR = 53
         bG = 114
         bB = 62
      ELSE
         bR = 54
         bG = 58
         bB = 69
      ENDIF
      IF bearAbsorption = 1 THEN
         sR = 153
         sG = 42
         sB = 55
      ELSE
         sR = 54
         sG = 58
         sB = 69
      ENDIF
      IF bullAbsorption = 1 THEN
         prR = 53
         prG = 114
         prB = 62
      ELSIF bearAbsorption = 1 THEN
         prR = 153
         prG = 42
         prB = 55
      ELSE
         prR = 54
         prG = 58
         prB = 69
      ENDIF
      IF emaReady = 1 AND close > myEma THEN
         emR = 48
         emG = 99
         emB = 57
      ELSE
         emR = 131
         emG = 39
         emB = 52
      ENDIF
      y0 = pT
      y1 = pT - rowH
      y2 = pT - 2 * rowH
      y3 = pT - 3 * rowH
      y4 = pT - 4 * rowH
      y5 = pT - 5 * rowH
      y6 = pT - 6 * rowH
      y7 = pT - 7 * rowH
      // row backgrounds
      DRAWRECTANGLE(pL, y0, pL + pW, y1) ANCHOR(TOPRIGHT, XSHIFT, YSHIFT) COLOURED(128, 128, 128, 255) FILLCOLOR(20, 30, 48, 255)
      DRAWRECTANGLE(pL, y1, xM, y6) ANCHOR(TOPRIGHT, XSHIFT, YSHIFT) COLOURED(128, 128, 128, 255) FILLCOLOR(39, 43, 54, 255)
      DRAWRECTANGLE(xM, y1, pL + pW, y2) ANCHOR(TOPRIGHT, XSHIFT, YSHIFT) COLOURED(128, 128, 128, 255) FILLCOLOR(vR, vG, vB, 255)
      DRAWRECTANGLE(xM, y2, pL + pW, y3) ANCHOR(TOPRIGHT, XSHIFT, YSHIFT) COLOURED(128, 128, 128, 255) FILLCOLOR(bR, bG, bB, 255)
      DRAWRECTANGLE(xM, y3, pL + pW, y4) ANCHOR(TOPRIGHT, XSHIFT, YSHIFT) COLOURED(128, 128, 128, 255) FILLCOLOR(sR, sG, sB, 255)
      DRAWRECTANGLE(xM, y4, pL + pW, y5) ANCHOR(TOPRIGHT, XSHIFT, YSHIFT) COLOURED(128, 128, 128, 255) FILLCOLOR(prR, prG, prB, 255)
      DRAWRECTANGLE(xM, y5, pL + pW, y6) ANCHOR(TOPRIGHT, XSHIFT, YSHIFT) COLOURED(128, 128, 128, 255) FILLCOLOR(emR, emG, emB, 255)
      DRAWRECTANGLE(pL, y6, xM, y7) ANCHOR(TOPRIGHT, XSHIFT, YSHIFT) COLOURED(128, 128, 128, 255) FILLCOLOR(20, 30, 48, 255)
      DRAWRECTANGLE(xM, y6, pL + pW, y7) ANCHOR(TOPRIGHT, XSHIFT, YSHIFT) COLOURED(128, 128, 128, 255) FILLCOLOR(28, 53, 122, 255)
      // row centres
      rw0 = pT - rowH * 0.5
      rw1 = pT - rowH * 1.5
      rw2 = pT - rowH * 2.5
      rw3 = pT - rowH * 3.5
      rw4 = pT - rowH * 4.5
      rw5 = pT - rowH * 5.5
      rw6 = pT - rowH * 6.5
      DRAWTEXT("THOMAS RADAR", xC0, rw0, monospaced, bold, pz) ANCHOR(TOPRIGHT, XSHIFT, YSHIFT) COLOURED(255, 255, 255, 255)
      DRAWTEXT("PRO", xC1, rw0, monospaced, bold, pz) ANCHOR(TOPRIGHT, XSHIFT, YSHIFT) COLOURED(0, 188, 212, 255)
      DRAWTEXT("Volume", xC0, rw1, monospaced, bold, pz) ANCHOR(TOPRIGHT, XSHIFT, YSHIFT) COLOURED(255, 255, 255, 255)
      DRAWTEXT("Buy Pressure", xC0, rw2, monospaced, bold, pz) ANCHOR(TOPRIGHT, XSHIFT, YSHIFT) COLOURED(255, 255, 255, 255)
      DRAWTEXT("Sell Pressure", xC0, rw3, monospaced, bold, pz) ANCHOR(TOPRIGHT, XSHIFT, YSHIFT) COLOURED(255, 255, 255, 255)
      DRAWTEXT("Pressure", xC0, rw4, monospaced, bold, pz) ANCHOR(TOPRIGHT, XSHIFT, YSHIFT) COLOURED(255, 255, 255, 255)
      DRAWTEXT("EMA Trend", xC0, rw5, monospaced, bold, pz) ANCHOR(TOPRIGHT, XSHIFT, YSHIFT) COLOURED(255, 255, 255, 255)
      DRAWTEXT("Last Event", xC0, rw6, monospaced, bold, pz) ANCHOR(TOPRIGHT, XSHIFT, YSHIFT) COLOURED(255, 255, 255, 255)
      IF volumeSpike = 1 THEN
         DRAWTEXT("HIGH VOLUME", xC1, rw1, monospaced, bold, pz) ANCHOR(TOPRIGHT, XSHIFT, YSHIFT) COLOURED(255, 255, 255, 255)
      ELSE
         DRAWTEXT("NORMAL", xC1, rw1, monospaced, bold, pz) ANCHOR(TOPRIGHT, XSHIFT, YSHIFT) COLOURED(255, 255, 255, 255)
      ENDIF
      IF bullAbsorption = 1 THEN
         DRAWTEXT("DETECTED", xC1, rw2, monospaced, bold, pz) ANCHOR(TOPRIGHT, XSHIFT, YSHIFT) COLOURED(255, 255, 255, 255)
      ELSE
         DRAWTEXT("NOT DETECTED", xC1, rw2, monospaced, bold, pz) ANCHOR(TOPRIGHT, XSHIFT, YSHIFT) COLOURED(255, 255, 255, 255)
      ENDIF
      IF bearAbsorption = 1 THEN
         DRAWTEXT("DETECTED", xC1, rw3, monospaced, bold, pz) ANCHOR(TOPRIGHT, XSHIFT, YSHIFT) COLOURED(255, 255, 255, 255)
      ELSE
         DRAWTEXT("NOT DETECTED", xC1, rw3, monospaced, bold, pz) ANCHOR(TOPRIGHT, XSHIFT, YSHIFT) COLOURED(255, 255, 255, 255)
      ENDIF
      IF bullAbsorption = 1 THEN
         DRAWTEXT("BUY PRESSURE", xC1, rw4, monospaced, bold, pz) ANCHOR(TOPRIGHT, XSHIFT, YSHIFT) COLOURED(255, 255, 255, 255)
      ELSIF bearAbsorption = 1 THEN
         DRAWTEXT("SELL PRESSURE", xC1, rw4, monospaced, bold, pz) ANCHOR(TOPRIGHT, XSHIFT, YSHIFT) COLOURED(255, 255, 255, 255)
      ELSE
         DRAWTEXT("NEUTRAL", xC1, rw4, monospaced, bold, pz) ANCHOR(TOPRIGHT, XSHIFT, YSHIFT) COLOURED(255, 255, 255, 255)
      ENDIF
      IF emaReady = 1 AND close > myEma THEN
         DRAWTEXT("BULLISH", xC1, rw5, monospaced, bold, pz) ANCHOR(TOPRIGHT, XSHIFT, YSHIFT) COLOURED(255, 255, 255, 255)
      ELSIF emaReady = 1 AND close < myEma THEN
         DRAWTEXT("BEARISH", xC1, rw5, monospaced, bold, pz) ANCHOR(TOPRIGHT, XSHIFT, YSHIFT) COLOURED(255, 255, 255, 255)
      ELSE
         DRAWTEXT("NEUTRAL", xC1, rw5, monospaced, bold, pz) ANCHOR(TOPRIGHT, XSHIFT, YSHIFT) COLOURED(255, 255, 255, 255)
      ENDIF
      IF lastEvent = 1 THEN
         DRAWTEXT("BUYER ABSORPTION", xC1, rw6, monospaced, bold, pz) ANCHOR(TOPRIGHT, XSHIFT, YSHIFT) COLOURED(255, 255, 255, 255)
      ELSIF lastEvent = 2 THEN
         DRAWTEXT("SELLER ABSORPTION", xC1, rw6, monospaced, bold, pz) ANCHOR(TOPRIGHT, XSHIFT, YSHIFT) COLOURED(255, 255, 255, 255)
      ELSE
         DRAWTEXT("WAITING", xC1, rw6, monospaced, bold, pz) ANCHOR(TOPRIGHT, XSHIFT, YSHIFT) COLOURED(255, 255, 255, 255)
      ENDIF
   ENDIF
ENDIF

RETURN myEma COLOURED(255, 152, 0, emaA) STYLE(line, 2) AS "Trend EMA"