







Simple Decision Matrix Classification Algorithm
Introduction
Can the current reading of an oscillator tell you something about the next candle? The Simple Decision Matrix Classification Algorithm answers that question with a transparent, easy-to-follow method. It looks back at the history of two variables of your choice, finds the moments when they were at a level similar to today’s, and checks what the following candle did. Each variable casts a vote, the votes are combined, and the result is a Bullish or Bearish prediction with its historical accuracy.
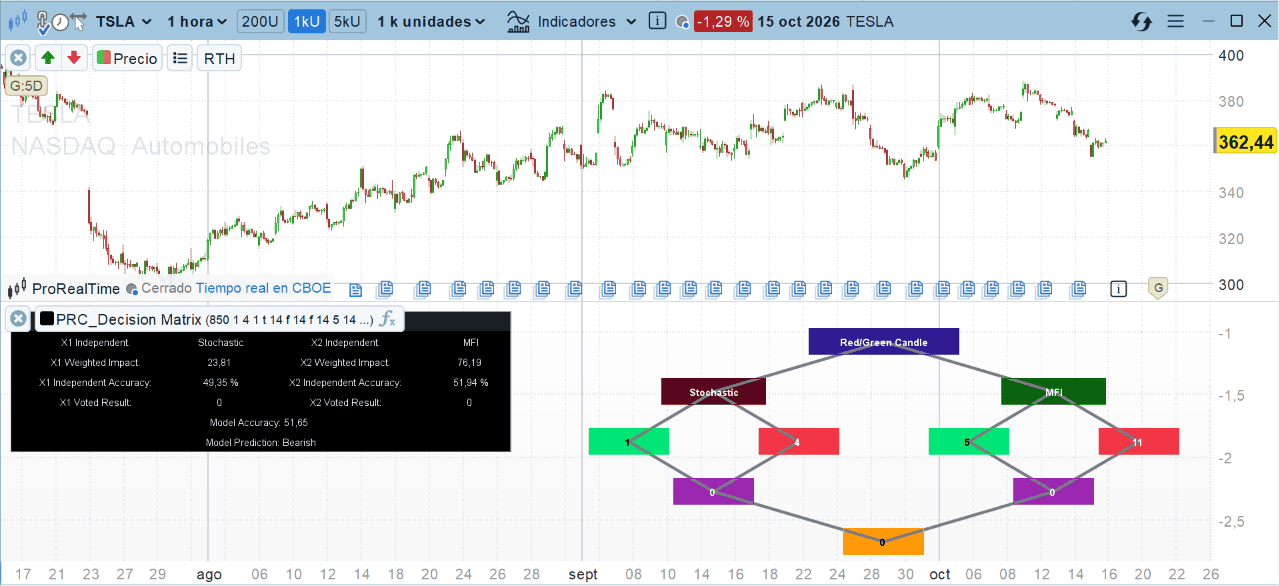
Everything is shown on a separate panel as a small decision tree and a statistics table, so you can see exactly where the prediction comes from.
Theory Behind the Indicator
The model works with two independent variables, X1 and X2, and one target Y.
- The independent variables can be the Stochastic %K (14), RSI, Z-Score, Money Flow Index, Volume, or the distance of the close to an EMA or an SMA.
- The target is binary: a green or red candle, a bullish or bearish candle by its wicks (high minus open against open minus low), or an ATR range breakout.
On every bar, the algorithm scans the training window (850 bars by default). For each past bar it pairs the value of the variable with the target of the next bar. A past value is “similar” when it lies within a fixed distance of the current value: 0.5 points for the oscillators and moving-average distances, 0.05 for the Z-Score, and one standard deviation of volume (14 bars) for Volume. For X1, only positive past values are taken into account.
Every similar case is sorted into one of two groups: the next candle met the target (pass) or it did not (fail). Then:
- Each variable votes 1 (bullish) when it has more passes than fails, and 0 otherwise.
- The model votes 1 when the passes of both variables together outnumber the fails.
To judge how much the vote can be trusted, the indicator also measures accuracy over the training window: how often each variable’s vote matched the actual target, and how often the combined vote did. The weighted impact of each variable is its share of all the similar cases found.
Key Features at a Glance
- Two independent variables chosen from seven, and three different target definitions.
- Similarity matching with thresholds adapted to each variable type.
- Independent vote and independent accuracy for each variable.
- Combined model vote with its accuracy over the training window.
- Decision tree drawn on the panel: target, variables, pass and fail counts, votes and final prediction.
- Feature importance colouring: the variable nodes turn bright green, dark green, dark red or bright red depending on their accuracy and on which variable is stronger.
- Statistics table with weighted impact, accuracies, votes, model accuracy and prediction.
- Selectable price source for the EMA/SMA, RSI, MFI and Z-Score.
How to Read the Indicator
Read the tree from top to bottom. The blue node at the top is the target being predicted. Below it, the two variable nodes; their colour shows the feature importance. Any variable above 55% accuracy is bright green. The stronger of the two is dark green up to 55%. The weaker one is green between 50% and 55%, dark red between 45% and 50% and bright red below 45%.
Under each variable, the green node counts the similar past cases where the target was met and the red node the cases where it was not. The purple node is the vote of that variable (1 bullish, 0 bearish). Both branches meet in the orange node at the bottom: the final prediction of the model.
The table gives the numbers behind the picture. A model accuracy close to 50% means the variables carry little information about the target on this instrument and timeframe; values clearly above it are more interesting. A variable with very few similar cases (a low weighted impact) is voting on thin evidence.
Practical Applications
- Filter for entries: only take long setups when the model predicts Bullish with an accuracy clearly above 50%.
- Variable selection: compare combinations of X1 and X2 on your market and keep the pair with the highest independent accuracies.
- Regime check: watch how the model accuracy changes over time; a falling accuracy shows that the relationship found in the past is fading.
- Teaching tool: the tree makes a simple classification model visible, case counts included.
Indicator Configuration
- training (default 850): number of past bars used to find similar cases and to measure accuracy.
- x1Sel (default 1): first variable. 1 Stochastic, 2 RSI, 3 Z-Score, 4 MFI, 5 Volume, 6 distance to EMA, 7 distance to SMA.
- x2Sel (default 5): second variable, same codes.
- ySel (default 1): target. 1 green/red candle, 2 bullish/bearish by wicks, 3 ATR range breakout.
- showTable (default 1): shows the statistics table.
- emaLen (default 14) and emaSrcT (default 0): length and source of the EMA and SMA.
- rsiLen (default 14) and rsiSrcT (default 0): length and source of the RSI.
- mfiLen (default 14) and mfiSrcT (default 5): length and source of the Money Flow Index.
- zLen (default 14) and zSrcT (default 0): length and source of the Z-Score.
- atrLen (default 14): ATR length for the breakout target.
- treeScale (default 1.7): horizontal spacing of the tree, in pixels.
- treeMargin (default 100): gap in pixels between the tree and the right edge of the panel, so that the last node is not hidden behind the price scale.
Source codes: 0 close, 1 open, 2 high, 3 low, 4 median price (HL/2), 5 typical price (HLC/3), 6 OHLC/4.
The tree needs about 260 pixels of panel height and about 700 pixels of width; enlarge the panel if the bottom node is cut, raise treeMargin if the right-hand node is hidden behind the price scale, and lower treeScale if the tree overlaps the table on a narrow window.
The Code
//---------------------------------------------------------------
// PRC_Decision Matrix DMCA
// version = 0
// 16.10.2026
// Iván González @ www.prorealcode.com
// Author: Steversteves
// Sharing ProRealTime knowledge
//--------------------------------------------------------------------//
// The tree and the table are redrawn on every update
DEFPARAM DRAWONLASTBARONLY = true
//--------------------------------------------------------------------//
// Inputs
//--------------------------------------------------------------------//
training = 850   // Training length (bars)
// Independent variables: 1 Stochastic, 2 RSI, 3 Z-Score, 4 MFI, 5 Volume, 6 EMA, 7 SMA
x1Sel = 1
x2Sel = 5
// Target: 1 Red/Green Candle, 2 Bullish/Bearish ATR, 3 ATR Range Breakout
ySel = 1
showTable = 1    // 1 = show the statistics table
// Sources: 0 close, 1 open, 2 high, 3 low, 4 median (HL/2), 5 typical (HLC/3), 6 OHLC/4
emaLen = 14      // EMA/SMA length
emaSrcT = 0      // EMA/SMA source
rsiLen = 14      // RSI length
rsiSrcT = 0      // RSI source
mfiLen = 14      // MFI length
mfiSrcT = 5      // MFI source
zLen = 14        // Z-Score length
zSrcT = 0        // Z-Score source
atrLen = 14      // ATR length
treeScale = 1.7  // Horizontal spacing of the tree (pixels per bar of the layout)
treeMargin = 100 // Gap between the tree and the right edge of the panel (pixels)
//--------------------------------------------------------------------//
// Sources
//--------------------------------------------------------------------//
srcE = close
IF emaSrcT = 1 THEN
   srcE = open
ELSIF emaSrcT = 2 THEN
   srcE = high
ELSIF emaSrcT = 3 THEN
   srcE = low
ELSIF emaSrcT = 4 THEN
   srcE = (high + low) / 2
ELSIF emaSrcT = 5 THEN
   srcE = (high + low + close) / 3
ELSIF emaSrcT = 6 THEN
   srcE = (open + high + low + close) / 4
ENDIF
srcR = close
IF rsiSrcT = 1 THEN
   srcR = open
ELSIF rsiSrcT = 2 THEN
   srcR = high
ELSIF rsiSrcT = 3 THEN
   srcR = low
ELSIF rsiSrcT = 4 THEN
   srcR = (high + low) / 2
ELSIF rsiSrcT = 5 THEN
   srcR = (high + low + close) / 3
ELSIF rsiSrcT = 6 THEN
   srcR = (open + high + low + close) / 4
ENDIF
srcM = close
IF mfiSrcT = 1 THEN
   srcM = open
ELSIF mfiSrcT = 2 THEN
   srcM = high
ELSIF mfiSrcT = 3 THEN
   srcM = low
ELSIF mfiSrcT = 4 THEN
   srcM = (high + low) / 2
ELSIF mfiSrcT = 5 THEN
   srcM = (high + low + close) / 3
ELSIF mfiSrcT = 6 THEN
   srcM = (open + high + low + close) / 4
ENDIF
srcZ = close
IF zSrcT = 1 THEN
   srcZ = open
ELSIF zSrcT = 2 THEN
   srcZ = high
ELSIF zSrcT = 3 THEN
   srcZ = low
ELSIF zSrcT = 4 THEN
   srcZ = (high + low) / 2
ELSIF zSrcT = 5 THEN
   srcZ = (high + low + close) / 3
ELSIF zSrcT = 6 THEN
   srcZ = (open + high + low + close) / 4
ENDIF
//--------------------------------------------------------------------//
// Features (each one with a validity flag: an invalid value never votes)
//--------------------------------------------------------------------//
// Stochastic %K (14, raw)
hh14 = highest[14](high)
ll14 = lowest[14](low)
sto = 0
stoOk = 0
IF barindex >= 13 AND hh14 - ll14 > 0 THEN
   sto = 100 * (close - ll14) / (hh14 - ll14)
   stoOk = 1
ENDIF
// RSI
myRsi = rsi[rsiLen](srcR)
rsiOk = 0
IF barindex >= rsiLen THEN
   rsiOk = 1
ENDIF
// Z-Score
zMean = average[zLen](srcZ)
zDev = std[zLen](srcZ)
zVal = 0
zOk = 0
IF barindex >= zLen - 1 AND zDev > 0 THEN
   zVal = (srcZ - zMean) / zDev
   zOk = 1
ENDIF
// Money Flow Index on the selected source
IF barindex = 0 THEN
   upF = srcM
   dnF = srcM
ELSE
   chM = srcM - srcM[1]
   upF = srcM
   IF 0 >= chM THEN
      upF = 0
   ENDIF
   dnF = srcM
   IF chM >= 0 THEN
      dnF = 0
   ENDIF
ENDIF
upS = summation[mfiLen](volume * upF)
dnS = summation[mfiLen](volume * dnF)
myMfi = 0
mfiOk = 0
IF barindex >= mfiLen - 1 AND dnS > 0 THEN
   myMfi = 100 - 100 / (1 + upS / dnS)
   mfiOk = 1
ENDIF
// Distance to the EMA and to the SMA
emaV = average[emaLen, 1](srcE)
smaV = average[emaLen](srcE)
maOk = 0
IF barindex >= emaLen - 1 THEN
   maOk = 1
ENDIF
// Volume threshold
volDev = std[14](volume)
//--------------------------------------------------------------------//
// Selected variables X1, X2 and target Y
//--------------------------------------------------------------------//
x1In = volume
x1Ok = 1
IF x1Sel = 1 THEN
   x1In = sto
   x1Ok = stoOk
ELSIF x1Sel = 2 THEN
   x1In = myRsi
   x1Ok = rsiOk
ELSIF x1Sel = 3 THEN
   x1In = zVal
   x1Ok = zOk
ELSIF x1Sel = 4 THEN
   x1In = myMfi
   x1Ok = mfiOk
ELSIF x1Sel = 6 THEN
   x1In = close - emaV
   x1Ok = maOk
ELSIF x1Sel = 7 THEN
   x1In = close - smaV
   x1Ok = maOk
ENDIF
x2In = volume
x2Ok = 1
IF x2Sel = 1 THEN
   x2In = sto
   x2Ok = stoOk
ELSIF x2Sel = 2 THEN
   x2In = myRsi
   x2Ok = rsiOk
ELSIF x2Sel = 3 THEN
   x2In = zVal
   x2Ok = zOk
ELSIF x2Sel = 4 THEN
   x2In = myMfi
   x2Ok = mfiOk
ELSIF x2Sel = 6 THEN
   x2In = close - emaV
   x2Ok = maOk
ELSIF x2Sel = 7 THEN
   x2In = close - smaV
   x2Ok = maOk
ENDIF
// Similarity thresholds
IF x1Sel = 5 THEN
   x1Thr = volDev
ELSIF x1Sel = 3 THEN
   x1Thr = 0.05
ELSE
   x1Thr = 0.5
ENDIF
IF x2Sel = 5 THEN
   x2Thr = volDev
ELSIF x2Sel = 3 THEN
   x2Thr = 0.05
ELSE
   x2Thr = 0.5
ENDIF
// Target classification
myAtr = averagetruerange[atrLen](close)
yIn = 0
IF ySel = 1 THEN
   IF close > open THEN
      yIn = 1
   ENDIF
ELSIF ySel = 2 THEN
   IF high - open > open - low THEN
      yIn = 1
   ENDIF
ELSE
   IF barindex >= atrLen - 1 THEN
      IF high - open > myAtr OR myAtr > open - low THEN
         yIn = 1
      ENDIF
   ENDIF
ENDIF
//--------------------------------------------------------------------//
// Decision matrix: past bars whose variable was close to the current
// value vote with the target of the bar that followed them
//--------------------------------------------------------------------//
y1p = 0
y1f = 0
y2p = 0
y2f = 0
lastRow = min(training - 2, barindex - 1)
IF lastRow >= 0 AND (x1Ok = 1 OR x2Ok = 1) THEN
   FOR k = 0 TO lastRow DO
      IF x1Ok = 1 AND x1Ok[k + 1] = 1 THEN
         v1 = x1In[k + 1]
         // the first variable only counts positive past values
         IF v1 > 0 AND v1 >= x1In - x1Thr AND x1In + x1Thr >= v1 THEN
            IF yIn[k] = 1 THEN
               y1p = y1p + 1
            ELSE
               y1f = y1f + 1
            ENDIF
         ENDIF
      ENDIF
      IF x2Ok = 1 AND x2Ok[k + 1] = 1 THEN
         v2 = x2In[k + 1]
         IF v2 >= x2In - x2Thr AND x2In + x2Thr >= v2 THEN
            IF yIn[k] = 1 THEN
               y2p = y2p + 1
            ELSE
               y2f = y2f + 1
            ENDIF
         ENDIF
      ENDIF
   NEXT
ENDIF
x1Vote = 0
IF y1p > y1f THEN
   x1Vote = 1
ENDIF
x2Vote = 0
IF y2p > y2f THEN
   x2Vote = 1
ENDIF
vote = 0
IF y1p + y2p > y1f + y2f THEN
   vote = 1
ENDIF
//--------------------------------------------------------------------//
// Accuracies
//--------------------------------------------------------------------//
// Independent accuracy: last training + 1 bars, bars before the
// start of the chart count as misses
x1Pass = 0
IF x1Vote = yIn THEN
   x1Pass = 1
ENDIF
x2Pass = 0
IF x2Vote = yIn THEN
   x2Pass = 1
ENDIF
once cX1 = 0
once cX2 = 0
cX1 = cX1 + x1Pass
cX2 = cX2 + x2Pass
IF barindex >= training + 1 THEN
   x1Hits = cX1 - cX1[training + 1]
   x2Hits = cX2 - cX2[training + 1]
ELSE
   x1Hits = cX1
   x2Hits = cX2
ENDIF
x1Acc = x1Hits / (training + 1) * 100
x2Acc = x2Hits / (training + 1) * 100
// Model accuracy: last training bars
mHit = 0
IF vote = yIn THEN
   mHit = 1
ENDIF
once cM = 0
cM = cM + mHit
IF barindex >= training THEN
   mHits = cM - cM[training]
   mCnt = training
ELSE
   mHits = cM
   mCnt = barindex + 1
ENDIF
acc = mHits / mCnt * 100
//--------------------------------------------------------------------//
// Drawing: decision tree (top right) and table (top left)
//--------------------------------------------------------------------//
IF islastbarupdate THEN
   tot1 = y1p + y1f
   tot2 = y2p + y2f
   totAll = tot1 + tot2
   w1 = 0
   w2 = 0
   IF totAll > 0 THEN
      w1 = round(tot1 / totAll * 10000) / 100
      w2 = round(tot2 / totAll * 10000) / 100
   ENDIF
   x1AccR = round(x1Acc * 100) / 100
   x2AccR = round(x2Acc * 100) / 100
   accR = round(acc * 100) / 100
   // Tree layout: the original places the nodes at bar offsets -250..+50
   // and at levels 30/20/10/0/-10; here they are fixed pixel positions,
   // kept clear of the price scale on the right
   xP50 = 0 - treeMargin - 40
   xN250 = xP50 - 300 * treeScale
   xN200 = xP50 - 250 * treeScale
   xN150 = xP50 - 200 * treeScale
   xN100 = xP50 - 150 * treeScale
   xN50 = xP50 - 100 * treeScale
   xN0 = xP50 - 50 * treeScale
   yL30 = -40
   yL20 = -90
   yL10 = -140
   yL0 = -190
   yLm10 = -240
   // Edges first, so the nodes are drawn on top of them
   DRAWSEGMENT(xN200, yL20, xN250, yL10) ANCHOR(TOPRIGHT, XSHIFT, YSHIFT) COLOURED(120, 123, 134) STYLE(line, 3)
   DRAWSEGMENT(xN250, yL10, xN200, yL0) ANCHOR(TOPRIGHT, XSHIFT, YSHIFT) COLOURED(120, 123, 134) STYLE(line, 3)
   DRAWSEGMENT(xN200, yL20, xN150, yL10) ANCHOR(TOPRIGHT, XSHIFT, YSHIFT) COLOURED(120, 123, 134) STYLE(line, 3)
   DRAWSEGMENT(xN150, yL10, xN200, yL0) ANCHOR(TOPRIGHT, XSHIFT, YSHIFT) COLOURED(120, 123, 134) STYLE(line, 3)
   DRAWSEGMENT(xN0, yL20, xN50, yL10) ANCHOR(TOPRIGHT, XSHIFT, YSHIFT) COLOURED(120, 123, 134) STYLE(line, 3)
   DRAWSEGMENT(xN50, yL10, xN0, yL0) ANCHOR(TOPRIGHT, XSHIFT, YSHIFT) COLOURED(120, 123, 134) STYLE(line, 3)
   DRAWSEGMENT(xN0, yL20, xP50, yL10) ANCHOR(TOPRIGHT, XSHIFT, YSHIFT) COLOURED(120, 123, 134) STYLE(line, 3)
   DRAWSEGMENT(xP50, yL10, xN0, yL0) ANCHOR(TOPRIGHT, XSHIFT, YSHIFT) COLOURED(120, 123, 134) STYLE(line, 3)
   DRAWSEGMENT(xN200, yL0, xN100, yLm10) ANCHOR(TOPRIGHT, XSHIFT, YSHIFT) COLOURED(120, 123, 134) STYLE(line, 3)
   DRAWSEGMENT(xN0, yL0, xN100, yLm10) ANCHOR(TOPRIGHT, XSHIFT, YSHIFT) COLOURED(120, 123, 134) STYLE(line, 3)
   DRAWSEGMENT(xN100, yL30, xN200, yL20) ANCHOR(TOPRIGHT, XSHIFT, YSHIFT) COLOURED(120, 123, 134) STYLE(line, 3)
   DRAWSEGMENT(xN100, yL30, xN0, yL20) ANCHOR(TOPRIGHT, XSHIFT, YSHIFT) COLOURED(120, 123, 134) STYLE(line, 3)
   // Target node (navy)
   DRAWRECTANGLE(xN100 - 75, yL30 + 13, xN100 + 75, yL30 - 13) ANCHOR(TOPRIGHT, XSHIFT, YSHIFT) COLOURED(49, 27, 146, 255) FILLCOLOR(49, 27, 146, 255)
   IF ySel = 1 THEN
      DRAWTEXT("Red/Green Candle", xN100, yL30, SansSerif, Bold, 10) ANCHOR(TOPRIGHT, XSHIFT, YSHIFT) COLOURED(255, 255, 255)
   ELSIF ySel = 2 THEN
      DRAWTEXT("Bullish / Bearish ATR", xN100, yL30, SansSerif, Bold, 10) ANCHOR(TOPRIGHT, XSHIFT, YSHIFT) COLOURED(255, 255, 255)
   ELSE
      DRAWTEXT("ATR Range Breakout", xN100, yL30, SansSerif, Bold, 10) ANCHOR(TOPRIGHT, XSHIFT, YSHIFT) COLOURED(255, 255, 255)
   ENDIF
   // Variable nodes, coloured by feature importance
   FOR fi = 1 TO 2 DO
      IF fi = 1 THEN
         curA = x1Acc
         othA = x2Acc
         nX = xN200
         nSel = x1Sel
      ELSE
         curA = x2Acc
         othA = x1Acc
         nX = xN0
         nSel = x2Sel
      ENDIF
      fA = 0
      fR = 0
      fG = 0
      fB = 0
      IF curA > othA THEN
         fA = 255
         IF 45 >= curA THEN
            fR = 5
            fG = 46
            fB = 7
         ELSIF 55 >= curA THEN
            fR = 10
            fG = 99
            fB = 14
         ELSE
            fR = 5
            fG = 235
            fB = 15
         ENDIF
      ELSIF othA > curA THEN
         fA = 255
         IF curA > 55 THEN
            fR = 5
            fG = 235
            fB = 15
         ELSIF curA > 50 THEN
            fR = 22
            fG = 110
            fB = 26
         ELSIF curA > 45 THEN
            fR = 89
            fG = 6
            fB = 31
         ELSE
            fR = 247
            fG = 0
            fB = 75
         ENDIF
      ENDIF
      // text in black on light nodes and in white on dark ones
      tC = 255
      IF fA > 0 AND 0.299 * fR + 0.587 * fG + 0.114 * fB > 140 THEN
         tC = 0
      ENDIF
      IF fA = 0 THEN
         tC = 0
      ENDIF
      DRAWRECTANGLE(nX - 52, yL20 + 13, nX + 52, yL20 - 13) ANCHOR(TOPRIGHT, XSHIFT, YSHIFT) COLOURED(fR, fG, fB, fA) FILLCOLOR(fR, fG, fB, fA)
      IF nSel = 1 THEN
         DRAWTEXT("Stochastic", nX, yL20, SansSerif, Bold, 10) ANCHOR(TOPRIGHT, XSHIFT, YSHIFT) COLOURED(tC, tC, tC)
      ELSIF nSel = 2 THEN
         DRAWTEXT("RSI", nX, yL20, SansSerif, Bold, 10) ANCHOR(TOPRIGHT, XSHIFT, YSHIFT) COLOURED(tC, tC, tC)
      ELSIF nSel = 3 THEN
         DRAWTEXT("Z-Score", nX, yL20, SansSerif, Bold, 10) ANCHOR(TOPRIGHT, XSHIFT, YSHIFT) COLOURED(tC, tC, tC)
      ELSIF nSel = 4 THEN
         DRAWTEXT("MFI", nX, yL20, SansSerif, Bold, 10) ANCHOR(TOPRIGHT, XSHIFT, YSHIFT) COLOURED(tC, tC, tC)
      ELSIF nSel = 5 THEN
         DRAWTEXT("Volume", nX, yL20, SansSerif, Bold, 10) ANCHOR(TOPRIGHT, XSHIFT, YSHIFT) COLOURED(tC, tC, tC)
      ELSIF nSel = 6 THEN
         DRAWTEXT("EMA", nX, yL20, SansSerif, Bold, 10) ANCHOR(TOPRIGHT, XSHIFT, YSHIFT) COLOURED(tC, tC, tC)
      ELSE
         DRAWTEXT("SMA", nX, yL20, SansSerif, Bold, 10) ANCHOR(TOPRIGHT, XSHIFT, YSHIFT) COLOURED(tC, tC, tC)
      ENDIF
   NEXT
   // Pass (green) and fail (red) counts, votes (purple), prediction (orange)
   DRAWRECTANGLE(xN250 - 40, yL10 + 13, xN250 + 40, yL10 - 13) ANCHOR(TOPRIGHT, XSHIFT, YSHIFT) COLOURED(0, 230, 118, 255) FILLCOLOR(0, 230, 118, 255)
   DRAWTEXT("#y1p#", xN250, yL10, SansSerif, Bold, 10) ANCHOR(TOPRIGHT, XSHIFT, YSHIFT) COLOURED(0, 0, 0)
   DRAWRECTANGLE(xN150 - 40, yL10 + 13, xN150 + 40, yL10 - 13) ANCHOR(TOPRIGHT, XSHIFT, YSHIFT) COLOURED(242, 54, 69, 255) FILLCOLOR(242, 54, 69, 255)
   DRAWTEXT("#y1f#", xN150, yL10, SansSerif, Bold, 10) ANCHOR(TOPRIGHT, XSHIFT, YSHIFT) COLOURED(255, 255, 255)
   DRAWRECTANGLE(xN200 - 40, yL0 + 13, xN200 + 40, yL0 - 13) ANCHOR(TOPRIGHT, XSHIFT, YSHIFT) COLOURED(156, 39, 176, 255) FILLCOLOR(156, 39, 176, 255)
   DRAWTEXT("#x1Vote#", xN200, yL0, SansSerif, Bold, 10) ANCHOR(TOPRIGHT, XSHIFT, YSHIFT) COLOURED(255, 255, 255)
   DRAWRECTANGLE(xN50 - 40, yL10 + 13, xN50 + 40, yL10 - 13) ANCHOR(TOPRIGHT, XSHIFT, YSHIFT) COLOURED(0, 230, 118, 255) FILLCOLOR(0, 230, 118, 255)
   DRAWTEXT("#y2p#", xN50, yL10, SansSerif, Bold, 10) ANCHOR(TOPRIGHT, XSHIFT, YSHIFT) COLOURED(0, 0, 0)
   DRAWRECTANGLE(xP50 - 40, yL10 + 13, xP50 + 40, yL10 - 13) ANCHOR(TOPRIGHT, XSHIFT, YSHIFT) COLOURED(242, 54, 69, 255) FILLCOLOR(242, 54, 69, 255)
   DRAWTEXT("#y2f#", xP50, yL10, SansSerif, Bold, 10) ANCHOR(TOPRIGHT, XSHIFT, YSHIFT) COLOURED(255, 255, 255)
   DRAWRECTANGLE(xN0 - 40, yL0 + 13, xN0 + 40, yL0 - 13) ANCHOR(TOPRIGHT, XSHIFT, YSHIFT) COLOURED(156, 39, 176, 255) FILLCOLOR(156, 39, 176, 255)
   DRAWTEXT("#x2Vote#", xN0, yL0, SansSerif, Bold, 10) ANCHOR(TOPRIGHT, XSHIFT, YSHIFT) COLOURED(255, 255, 255)
   DRAWRECTANGLE(xN100 - 40, yLm10 + 13, xN100 + 40, yLm10 - 13) ANCHOR(TOPRIGHT, XSHIFT, YSHIFT) COLOURED(255, 152, 0, 255) FILLCOLOR(255, 152, 0, 255)
   DRAWTEXT("#vote#", xN100, yLm10, SansSerif, Bold, 10) ANCHOR(TOPRIGHT, XSHIFT, YSHIFT) COLOURED(0, 0, 0)
   // Statistics table
   IF showTable = 1 THEN
      DRAWRECTANGLE(10, -10, 510, -150) ANCHOR(TOPLEFT, XSHIFT, YSHIFT) COLOURED(120, 123, 134, 255) FILLCOLOR(0, 0, 0, 255)
      DRAWRECTANGLE(10, -10, 510, -30) ANCHOR(TOPLEFT, XSHIFT, YSHIFT) COLOURED(120, 123, 134, 0) FILLCOLOR(120, 123, 134, 64)
      // variable names: header row and "Independent" row
      FOR fi = 1 TO 2 DO
         IF fi = 1 THEN
            nSel = x1Sel
            cX = 10
         ELSE
            nSel = x2Sel
            cX = 260
         ENDIF
         FOR sp = 0 TO 1 DO
            IF sp = 0 THEN
               tX = cX + 125
               tY = -20
            ELSE
               tX = cX + 210
               tY = -40
            ENDIF
            IF nSel = 1 THEN
               DRAWTEXT("Stochastic", tX, tY, SansSerif, Standard, 10) ANCHOR(TOPLEFT, XSHIFT, YSHIFT) COLOURED(255, 255, 255)
            ELSIF nSel = 2 THEN
               DRAWTEXT("RSI", tX, tY, SansSerif, Standard, 10) ANCHOR(TOPLEFT, XSHIFT, YSHIFT) COLOURED(255, 255, 255)
            ELSIF nSel = 3 THEN
               DRAWTEXT("Z-Score", tX, tY, SansSerif, Standard, 10) ANCHOR(TOPLEFT, XSHIFT, YSHIFT) COLOURED(255, 255, 255)
            ELSIF nSel = 4 THEN
               DRAWTEXT("MFI", tX, tY, SansSerif, Standard, 10) ANCHOR(TOPLEFT, XSHIFT, YSHIFT) COLOURED(255, 255, 255)
            ELSIF nSel = 5 THEN
               DRAWTEXT("Volume", tX, tY, SansSerif, Standard, 10) ANCHOR(TOPLEFT, XSHIFT, YSHIFT) COLOURED(255, 255, 255)
            ELSIF nSel = 6 THEN
               DRAWTEXT("EMA", tX, tY, SansSerif, Standard, 10) ANCHOR(TOPLEFT, XSHIFT, YSHIFT) COLOURED(255, 255, 255)
            ELSE
               DRAWTEXT("SMA", tX, tY, SansSerif, Standard, 10) ANCHOR(TOPLEFT, XSHIFT, YSHIFT) COLOURED(255, 255, 255)
            ENDIF
         NEXT
      NEXT
      DRAWTEXT("X1 Independent:", 95, -40, SansSerif, Standard, 10) ANCHOR(TOPLEFT, XSHIFT, YSHIFT) COLOURED(255, 255, 255)
      DRAWTEXT("X1 Weighted Impact:", 95, -60, SansSerif, Standard, 10) ANCHOR(TOPLEFT, XSHIFT, YSHIFT) COLOURED(255, 255, 255)
      DRAWTEXT("X1 Independent Accuracy:", 95, -80, SansSerif, Standard, 10) ANCHOR(TOPLEFT, XSHIFT, YSHIFT) COLOURED(255, 255, 255)
      DRAWTEXT("X1 Voted Result:", 95, -100, SansSerif, Standard, 10) ANCHOR(TOPLEFT, XSHIFT, YSHIFT) COLOURED(255, 255, 255)
      DRAWTEXT("X2 Independent:", 345, -40, SansSerif, Standard, 10) ANCHOR(TOPLEFT, XSHIFT, YSHIFT) COLOURED(255, 255, 255)
      DRAWTEXT("X2 Weighted Impact:", 345, -60, SansSerif, Standard, 10) ANCHOR(TOPLEFT, XSHIFT, YSHIFT) COLOURED(255, 255, 255)
      DRAWTEXT("X2 Independent Accuracy:", 345, -80, SansSerif, Standard, 10) ANCHOR(TOPLEFT, XSHIFT, YSHIFT) COLOURED(255, 255, 255)
      DRAWTEXT("X2 Voted Result:", 345, -100, SansSerif, Standard, 10) ANCHOR(TOPLEFT, XSHIFT, YSHIFT) COLOURED(255, 255, 255)
      IF totAll > 0 THEN
         DRAWTEXT("#w1#", 220, -60, SansSerif, Standard, 10) ANCHOR(TOPLEFT, XSHIFT, YSHIFT) COLOURED(255, 255, 255)
         DRAWTEXT("#w2#", 470, -60, SansSerif, Standard, 10) ANCHOR(TOPLEFT, XSHIFT, YSHIFT) COLOURED(255, 255, 255)
      ELSE
         DRAWTEXT("NaN", 220, -60, SansSerif, Standard, 10) ANCHOR(TOPLEFT, XSHIFT, YSHIFT) COLOURED(255, 255, 255)
         DRAWTEXT("NaN", 470, -60, SansSerif, Standard, 10) ANCHOR(TOPLEFT, XSHIFT, YSHIFT) COLOURED(255, 255, 255)
      ENDIF
      DRAWTEXT("#x1AccR#%", 220, -80, SansSerif, Standard, 10) ANCHOR(TOPLEFT, XSHIFT, YSHIFT) COLOURED(255, 255, 255)
      DRAWTEXT("#x2AccR#%", 470, -80, SansSerif, Standard, 10) ANCHOR(TOPLEFT, XSHIFT, YSHIFT) COLOURED(255, 255, 255)
      DRAWTEXT("#x1Vote#", 220, -100, SansSerif, Standard, 10) ANCHOR(TOPLEFT, XSHIFT, YSHIFT) COLOURED(255, 255, 255)
      DRAWTEXT("#x2Vote#", 470, -100, SansSerif, Standard, 10) ANCHOR(TOPLEFT, XSHIFT, YSHIFT) COLOURED(255, 255, 255)
      DRAWTEXT("Model Accuracy: #accR#", 260, -120, SansSerif, Standard, 10) ANCHOR(TOPLEFT, XSHIFT, YSHIFT) COLOURED(255, 255, 255)
      IF vote = 1 THEN
         DRAWTEXT("Model Prediction: Bullish", 260, -140, SansSerif, Standard, 10) ANCHOR(TOPLEFT, XSHIFT, YSHIFT) COLOURED(255, 255, 255)
      ELSE
         DRAWTEXT("Model Prediction: Bearish", 260, -140, SansSerif, Standard, 10) ANCHOR(TOPLEFT, XSHIFT, YSHIFT) COLOURED(255, 255, 255)
      ENDIF
   ENDIF
ENDIF
RETURN
Conclusion
The Decision Matrix Classification Algorithm is not a black box: every vote can be traced back to a count of similar past cases. That makes it a good companion for testing whether an oscillator or volume reading really has predictive value on a given market before relying on it.