







RiskMetrics: Sharpe and Sortino Ratios of Any Instrument
Introduction
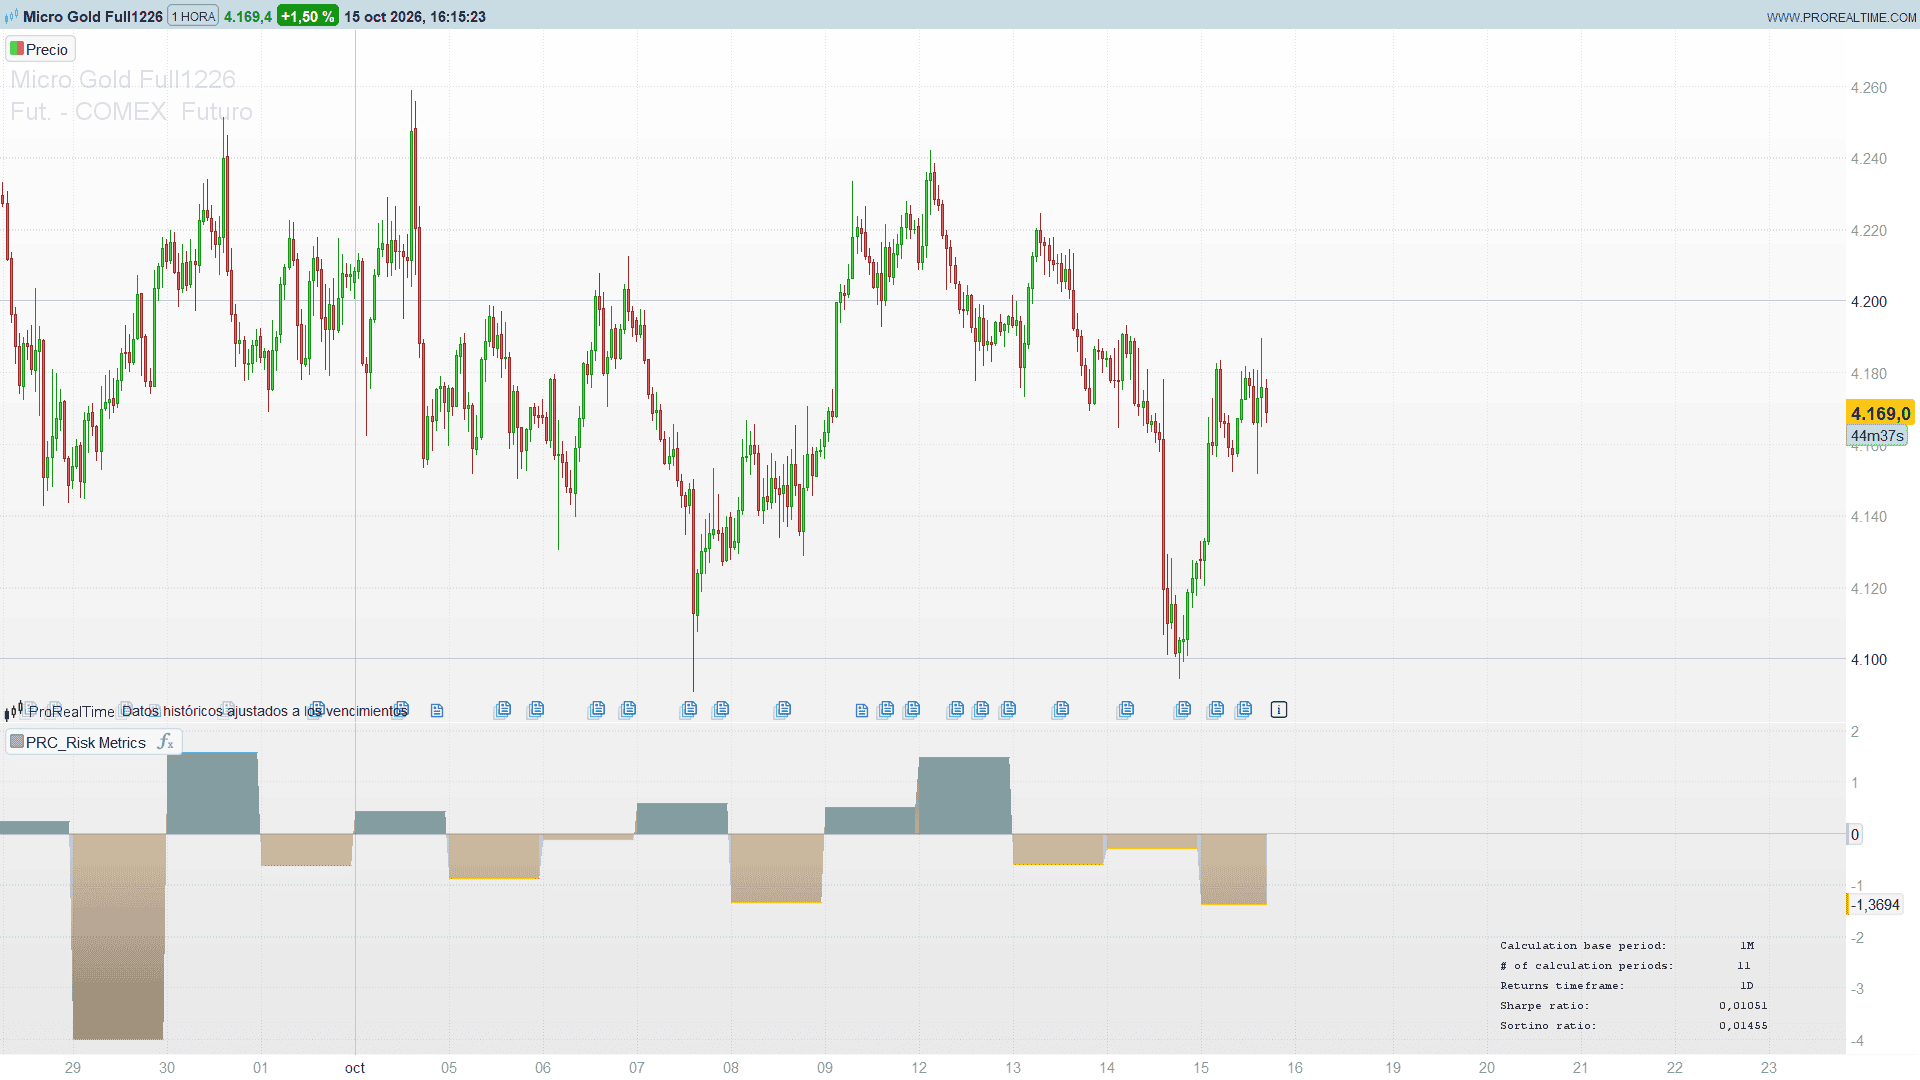
How good has an instrument been, once you account for the risk it took to get there? The Sharpe and Sortino ratios are the standard answer, but they are usually calculated in a spreadsheet, far from the chart. RiskMetrics brings them to the chart: it samples the returns of the instrument month by month and shows both ratios for the last five years in a small panel, next to a plot of the sampled returns.
Theory Behind the Indicator
The indicator works with periodic returns. By default it takes the monthly return of the instrument, close to close, and keeps the last 60 months in a queue.
The Sharpe ratio compares the average monthly return with a risk-free benchmark and divides the difference by the volatility of those returns:
Sharpe = (average return – benchmark) / standard deviation of returns
The benchmark is entered as an annual rate (2% by default) and divided by 12 to get its monthly equivalent. The standard deviation is the population one, calculated over the same months.
The Sortino ratio uses the same numerator but a different idea of risk. Only the months below the benchmark count as risk; months above it are not penalised:
Sortino = (average return – benchmark) / downside deviation
downside deviation = square root of (sum of (return – benchmark)^2 over the months below the benchmark, divided by the total number of months)
A strategy or an asset with frequent small losses and occasional large gains will look better in Sortino than in Sharpe, because Sharpe also penalises the upside volatility.
Returns can be sampled on another timeframe (day or week), or taken bar by bar from the chart. Whatever the sampling, they are compounded inside each calendar month, so the ratios are always based on monthly returns.
On intraday charts, days, weeks and months follow the trading sessions of the instrument, the same cut as its daily candles. On futures whose session opens the evening before, that evening already belongs to the next trading day.
Key Features at a Glance
- Sharpe and Sortino ratios over the last N monthly returns (60 by default).
- Annual benchmark rate, converted to its monthly equivalent.
- Returns sampled monthly, weekly, daily or from the chart bars.
- Stepped plot of the sampled return, aqua when positive and orange when negative, filled down to zero.
- Panel with the base period, the number of months used, the returns timeframe and both ratios.
- Months without data on charts above the monthly timeframe are counted as zero returns.
How to Read the Indicator
The line shows the last completed period’s return and stays flat until the next one is known: on a daily chart with the default settings, each step is one month. Aqua steps are positive months, orange steps negative ones. The jump between two steps is not drawn, so each month is a separate level.
In the panel, a Sharpe ratio above zero means the instrument has beaten the benchmark per unit of total risk; the higher, the better the risk-adjusted performance. Monthly ratios are smaller than the annualised figures often quoted in fund factsheets (multiply by roughly the square root of 12 to compare). A Sortino clearly higher than the Sharpe means most of the volatility came from the upside.
The number of calculation periods tells you how many months are behind the figures. With less history than the maximum, the ratios use what is available; a ratio based on a handful of months says very little. If the panel shows NaN, there is no data yet, or all returns are identical.
Practical Applications
- Compare instruments: apply it to several assets on the same timeframe to see which one paid better for its risk over the last five years.
- Check a market regime: a Sharpe falling towards zero shows that recent returns no longer compensate their volatility.
- Choose the risk measure: compare Sharpe and Sortino to see whether volatility is coming from losses or from gains.
- Set your own hurdle: change the benchmark to the cash rate you could actually earn.
Indicator Configuration
- retTf (default 3): returns timeframe. 0 uses the chart bars, 1 daily, 2 weekly, 3 monthly. It must be equal to or higher than the chart timeframe; otherwise the panel shows a warning.
- benchPct (default 2): annual benchmark rate in percent, compared monthly (benchPct / 12).
- maxPer (default 60): maximum number of monthly returns used in the ratios.
The Code
//---------------------------------------------------------------
// PRC_RiskMetrics
// version = 0
// 15.10.2026
// Iván González @ www.prorealcode.com
// Author: RiskMetrics library (open source, MPL 2.0)
// Sharing ProRealTime knowledge
//--------------------------------------------------------------------//
// The ratio panel is redrawn on every update
defparam drawonlastbaronly = true
//--------------------------------------------------------------------//
// Inputs
//--------------------------------------------------------------------//
retTf = 3          // Returns timeframe: 0 = chart bars, 1 = day, 2 = week, 3 = month
benchPct = 2       // Benchmark percentage (annual)
maxPer = 60        // Max number of monthly periods used
//--------------------------------------------------------------------//
// Calendar keys and chart timeframe
//--------------------------------------------------------------------//
yy = floor(date / 10000)
mm = floor(date / 100) - yy * 100
dd = date - floor(date / 100) * 100
jA = floor((14 - mm) / 12)
jY = yy + 4800 - jA
jM = mm + 12 * jA - 3
// day number: a new week starts every Monday
jdn = dd + floor((153 * jM + 2) / 5) + 365 * jY + floor(jY / 4) - floor(jY / 100) + floor(jY / 400) - 32045
monthKey = yy * 12 + mm
weekKey = floor(jdn / 7)
dayKey = date
tfSec = GetTimeFrame
IF tfSec < 86400 THEN
   chartCat = 0
ELSIF tfSec < 604800 THEN
   chartCat = 1
ELSIF tfSec < 2419200 THEN
   chartCat = 2
ELSE
   chartCat = 3
ENDIF
// charts above one month (quarterly, yearly) skip months
isIntramonth = 0
IF tfSec < 5000000 THEN
   isIntramonth = 1
ENDIF
//--------------------------------------------------------------------//
// Intraday charts: days, weeks and months follow the trading sessions,
// like the daily candles. A session that opens the evening before
// (futures) changes date halfway: it belongs to the next date.
//--------------------------------------------------------------------//
once nSes = 0
once sesCross = 0
once curCross = 0
IF chartCat = 0 THEN
   IF barindex = 0 OR intradaybarindex = 0 THEN
      IF barindex > 0 THEN
         nSes = nSes + 1
         sesCross = curCross
      ENDIF
      curCross = 0
      sesWeek = weekKey
      sesMonth = monthKey
      IF sesCross = 1 THEN
         sesWeek = floor((jdn + 1) / 7)
         lastDay = 31
         IF mm = 4 OR mm = 6 OR mm = 9 OR mm = 11 THEN
            lastDay = 30
         ELSIF mm = 2 THEN
            lastDay = 28
            IF yy - floor(yy / 4) * 4 = 0 AND (yy - floor(yy / 100) * 100 <> 0 OR yy - floor(yy / 400) * 400 = 0) THEN
               lastDay = 29
            ENDIF
         ENDIF
         IF dd = lastDay THEN
            sesMonth = monthKey + 1
         ENDIF
      ENDIF
   ELSIF date <> date[1] THEN
      curCross = 1
   ENDIF
   dayKey = nSes
   weekKey = sesWeek
   monthKey = sesMonth
ENDIF
//--------------------------------------------------------------------//
// One-bar return (open to close on the first bar)
//--------------------------------------------------------------------//
IF barindex = 0 THEN
   retPct = 100 * (close - open) / open
ELSE
   retPct = 100 * (close - close[1]) / close[1]
ENDIF
//--------------------------------------------------------------------//
// Returns of the selected timeframe, sampled once per period
//--------------------------------------------------------------------//
IF retTf = 1 THEN
   pKey = dayKey
   pCat = 1
ELSIF retTf = 2 THEN
   pKey = weekKey
   pCat = 2
ELSIF retTf = 3 THEN
   pKey = monthKey
   pCat = 3
ELSE
   pKey = barindex
   pCat = chartCat
ENDIF
isHtf = 0
IF pCat > chartCat THEN
   isHtf = 1
ENDIF
tfError = 0
IF pCat < chartCat THEN
   tfError = 1
ENDIF
newP = 0
IF barindex > 0 AND pKey <> pKey[1] THEN
   newP = 1
ENDIF
// return of the last completed period, known on the first bar of the next one
once nP = 0
htfRet = 0
IF barindex = 0 THEN
   pOpen = open
ELSIF newP = 1 THEN
   IF nP = 0 THEN
      htfRet = 100 * (close[1] - pOpen) / pOpen
   ELSE
      htfRet = 100 * (close[1] - lastPClose) / lastPClose
   ENDIF
   lastPClose = close[1]
   nP = nP + 1
   pOpen = open
ENDIF
IF isHtf = 1 THEN
   chg = htfRet
   chgOk = newP
ELSE
   chg = retPct
   chgOk = 1
ENDIF
//--------------------------------------------------------------------//
// Monthly returns: compounded inside each month, queued at the month change
//--------------------------------------------------------------------//
once base = 100
once hasHist = 0
once nM = 0
IF chgOk = 1 THEN
   base = base * (1 + chg / 100)
   hasHist = 1
ENDIF
newMonth = 0
IF barindex > 0 AND monthKey <> monthKey[1] THEN
   newMonth = 1
ENDIF
IF isIntramonth = 1 OR barindex = 0 THEN
   mChanges = 0
ELSE
   mChanges = monthKey - monthKey[1]
ENDIF
IF newMonth = 1 THEN
   IF hasHist = 1 THEN
      IF mChanges > 1 THEN
         FOR k = 2 TO mChanges DO
            $mRet[nM] = 0
            nM = nM + 1
         NEXT
      ENDIF
      $mRet[nM] = base - 100
      nM = nM + 1
   ENDIF
   base = 100
ENDIF
//--------------------------------------------------------------------//
// Plot: sampled return held until the next sample, filled to zero
//--------------------------------------------------------------------//
once hasPlot = 0
IF chgOk = 1 THEN
   plotV = chg
   hasPlot = 1
ELSIF hasPlot = 1 THEN
   plotV = plotV[1]
ELSE
   plotV = undefined
ENDIF
IF plotV < 0 THEN
   cR = 255
   cG = 152
   cB = 0
ELSE
   cR = 0
   cG = 188
   cB = 212
ENDIF
cA = 255
fA = 51
// the jump to a new sample is not drawn
IF (chgOk = 1 AND isHtf = 1) OR tfError = 1 THEN
   cA = 0
   fA = 0
ENDIF
COLORBETWEEN(plotV, 0, cR, cG, cB, fA)
//--------------------------------------------------------------------//
// Sharpe and Sortino ratios over the last monthly returns
//--------------------------------------------------------------------//
IF islastbarupdate THEN
   nUse = min(nM, maxPer)
   fixedRet = benchPct / 12
   txR = 40
   txG = 40
   txB = 40
   IF tfError = 1 THEN
      DRAWTEXT("For accurate ratios, the returns timeframe must be greater than or equal to the chart timeframe.", -420, 30, sansserif, bold, 10) COLOURED(200, 0, 0) ANCHOR(BOTTOMRIGHT, XSHIFT, YSHIFT)
   ELSE
      ratioOk = 0
      sortOk = 0
      IF nUse > 0 THEN
         sumR = 0
         FOR k = nM - nUse TO nM - 1 DO
            sumR = sumR + $mRet[k]
         NEXT
         avgR = sumR / nUse
         sumSq = 0
         sumDn = 0
         FOR k = nM - nUse TO nM - 1 DO
            sumSq = sumSq + square($mRet[k] - avgR)
            IF $mRet[k] < fixedRet THEN
               sumDn = sumDn + square($mRet[k] - fixedRet)
            ENDIF
         NEXT
         sdR = sqrt(sumSq / nUse)
         dnDev = sqrt(sumDn / nUse)
         IF sdR > 0 THEN
            shV = round((avgR - fixedRet) / sdR * 100000) / 100000
            ratioOk = 1
         ENDIF
         IF dnDev > 0 THEN
            soV = round((avgR - fixedRet) / dnDev * 100000) / 100000
            sortOk = 1
         ENDIF
      ENDIF
      DRAWTEXT("Calculation base period: ", -330, 110, monospaced, standard, 11) COLOURED(txR, txG, txB) ANCHOR(BOTTOMRIGHT, XSHIFT, YSHIFT)
      DRAWTEXT("# of calculation periods:", -330, 90, monospaced, standard, 11) COLOURED(txR, txG, txB) ANCHOR(BOTTOMRIGHT, XSHIFT, YSHIFT)
      DRAWTEXT("Returns timeframe:       ", -330, 70, monospaced, standard, 11) COLOURED(txR, txG, txB) ANCHOR(BOTTOMRIGHT, XSHIFT, YSHIFT)
      DRAWTEXT("Sharpe ratio:            ", -330, 50, monospaced, standard, 11) COLOURED(txR, txG, txB) ANCHOR(BOTTOMRIGHT, XSHIFT, YSHIFT)
      DRAWTEXT("Sortino ratio:           ", -330, 30, monospaced, standard, 11) COLOURED(txR, txG, txB) ANCHOR(BOTTOMRIGHT, XSHIFT, YSHIFT)
      DRAWTEXT("1M", -170, 110, monospaced, standard, 11) COLOURED(txR, txG, txB) ANCHOR(BOTTOMRIGHT, XSHIFT, YSHIFT)
      DRAWTEXT("#nUse#", -170, 90, monospaced, standard, 11) COLOURED(txR, txG, txB) ANCHOR(BOTTOMRIGHT, XSHIFT, YSHIFT)
      IF retTf = 1 THEN
         DRAWTEXT("1D", -170, 70, monospaced, standard, 11) COLOURED(txR, txG, txB) ANCHOR(BOTTOMRIGHT, XSHIFT, YSHIFT)
      ELSIF retTf = 2 THEN
         DRAWTEXT("1W", -170, 70, monospaced, standard, 11) COLOURED(txR, txG, txB) ANCHOR(BOTTOMRIGHT, XSHIFT, YSHIFT)
      ELSIF retTf = 3 THEN
         DRAWTEXT("1M", -170, 70, monospaced, standard, 11) COLOURED(txR, txG, txB) ANCHOR(BOTTOMRIGHT, XSHIFT, YSHIFT)
      ELSIF chartCat = 0 THEN
         chartMinV = round(tfSec / 60)
         DRAWTEXT("#chartMinV#", -170, 70, monospaced, standard, 11) COLOURED(txR, txG, txB) ANCHOR(BOTTOMRIGHT, XSHIFT, YSHIFT)
      ELSIF chartCat = 1 THEN
         DRAWTEXT("1D", -170, 70, monospaced, standard, 11) COLOURED(txR, txG, txB) ANCHOR(BOTTOMRIGHT, XSHIFT, YSHIFT)
      ELSIF chartCat = 2 THEN
         DRAWTEXT("1W", -170, 70, monospaced, standard, 11) COLOURED(txR, txG, txB) ANCHOR(BOTTOMRIGHT, XSHIFT, YSHIFT)
      ELSE
         DRAWTEXT("1M", -170, 70, monospaced, standard, 11) COLOURED(txR, txG, txB) ANCHOR(BOTTOMRIGHT, XSHIFT, YSHIFT)
      ENDIF
      IF ratioOk = 1 THEN
         DRAWTEXT("#shV#", -170, 50, monospaced, standard, 11) COLOURED(txR, txG, txB) ANCHOR(BOTTOMRIGHT, XSHIFT, YSHIFT)
      ELSE
         DRAWTEXT("NaN", -170, 50, monospaced, standard, 11) COLOURED(txR, txG, txB) ANCHOR(BOTTOMRIGHT, XSHIFT, YSHIFT)
      ENDIF
      IF sortOk = 1 THEN
         DRAWTEXT("#soV#", -170, 30, monospaced, standard, 11) COLOURED(txR, txG, txB) ANCHOR(BOTTOMRIGHT, XSHIFT, YSHIFT)
      ELSE
         DRAWTEXT("NaN", -170, 30, monospaced, standard, 11) COLOURED(txR, txG, txB) ANCHOR(BOTTOMRIGHT, XSHIFT, YSHIFT)
      ENDIF
   ENDIF
ENDIF
//--------------------------------------------------------------------//
RETURN plotV COLOURED(cR, cG, cB, cA) AS "Sampled price return", 0 COLOURED(120, 123, 134, 102) AS "Zero level"
Conclusion
RiskMetrics puts two of the most common risk-adjusted measures where traders actually look: on the chart. It does not replace a full performance analysis, but it gives a fast and honest answer to a simple question: has this instrument been worth its risk lately?