






Intraday Spark Chart: Each Session as a Percentage From the Daily Open
Introduction
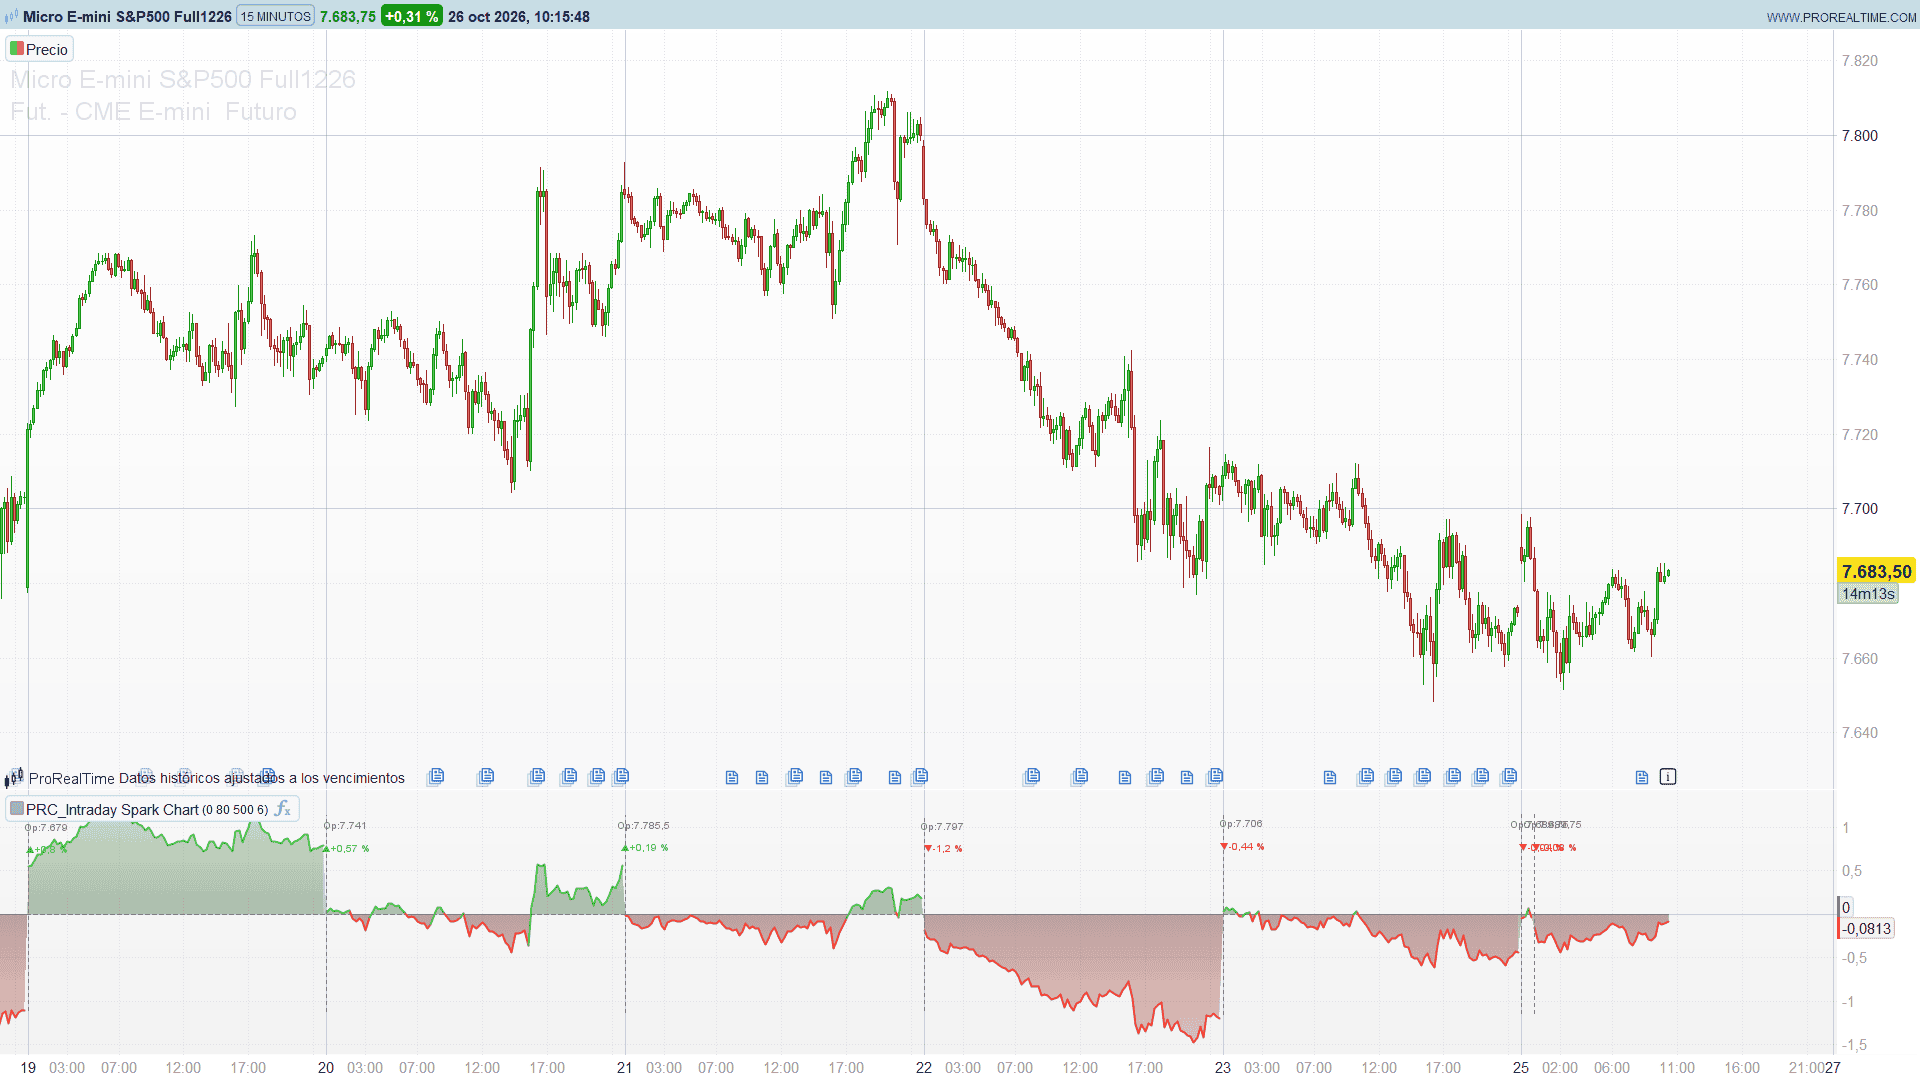
On an intraday chart the question that matters most is often the simplest one: is the market up or down on the day, and by how much? Candles answer it only if you keep the daily open in your head. The Intraday Spark Chart by AstrideUnicorn answers it directly. In a separate panel it draws the move of every session as a percentage from that day’s open, in green while price trades above the open and in red while it trades below, and it closes each day with a label that gives its final change.
The result reads like a row of small sparkline charts, one per session, all on the same percentage scale. Strong days, weak days, reversals and quiet sessions stand out at a glance, and two sessions can be compared even when price has moved a long way between them.
Theory Behind the Indicator
Change from the open. On every bar the indicator computes (close – daily open) / daily open x 100. The value starts near zero on the first bar of each session and tells you, bar by bar, where price is relative to the open of the day.
One sparkline per session. The line and the shaded area are green above zero and red below it. The first bar of each new session breaks the line, so the end of one day is never joined to the start of the next. A dotted zero line marks the daily open.
Day markers. Each session starts with a dotted vertical separator. Next to it, the indicator writes the opening price of the day (“Op:”) and the change of the day: an arrow and a signed percentage, green for an up day and red for a down day. The label shows the final change of each past session and the current change of today’s session.
Scaled to the market. The separators and labels need a height that suits the instrument: a 0.3% day is big for a currency pair and small for a crypto. The indicator uses the average daily range as a percentage of the open over the last 500 days (or over all the days loaded on the chart if there are fewer), and places the separators at 1.1 times that value, the opening price at 1 times and the change label at 0.75 times.
Intraday only. On timeframes above 4 hours a daily open has no meaning for a single bar, so the indicator draws nothing and shows a message asking for a lower timeframe.
Key Features at a Glance
- Percentage change from the daily open, bar by bar.
- Green above the open, red below, with a line and a shaded area.
- A clean break between sessions.
- Dotted day separators, the opening price and the final change of each day.
- Heights scaled to the average daily range of the instrument.
- Works on any intraday timeframe up to 4 hours.
How to Read the Indicator
- A session that stays green after the first hour is an up day in progress; one that crosses back and forth around zero is a balanced, rotational day.
- The shape of each sparkline shows how the day was built: a steady climb, a morning spike that fades, a late reversal.
- The final change labels give the history of the last sessions at a glance, which helps to judge whether today’s move is normal or large for this market.
- Compare against the separators: the dotted separators sit at about one average daily range above and below zero, so a session that reaches them is already a wide-range day.
Practical Applications
- Day-type recognition: trend days move away from zero early and stay there; range days keep returning to it.
- Relative size of the move: the percentage scale makes today comparable with the previous sessions without looking at prices.
- Bias for intraday trading: being above or below the daily open is a simple filter for long or short setups.
- Session reviews: the labels give a quick record of the last days’ changes.
Indicator Configuration
- outlineTransp (default 0): transparency of the main line, from 0 (opaque) to 100 (invisible).
- areaTransp (default 80): transparency of the shaded area.
- posR, posG, posB (default 76, 175, 80): colour when price is above the daily open.
- negR, negG, negB (default 244, 67, 54): colour when price is below the daily open.
- neuR, neuG, neuB (default 120, 123, 134): colour of the zero line, the separators and the opening price.
- atrDays (default 500): days in the average daily range used to scale separators and labels.
- labelShift (default 6): the labels are centred this many bars to the right of the start of the day. Raise it if they overlap the separator when you zoom in, lower it when you zoom out.
The indicator works on the instrument of the chart. To follow another market, apply it on that market’s chart. The last 500 separators and the labels of the last 250 sessions are drawn.
The Code
//---------------------------------------------------------------
// PRC_Intraday Spark Chart
// version = 0
// 23.10.2026
// Iván González @ www.prorealcode.com
// Author: AstrideUnicorn
// Sharing ProRealTime knowledge
//--------------------------------------------------------------------//
defparam drawonlastbaronly = true
//--------------------------------------------------------------------//
// Inputs
//--------------------------------------------------------------------//
outlineTransp = 0     // main line transparency: 0 = opaque, 100 = invisible
areaTransp = 80       // area fill transparency: 0 = opaque, 100 = invisible
// Positive colour (price above the daily open)
posR = 76
posG = 175
posB = 80
// Negative colour (price below the daily open)
negR = 244
negG = 67
negB = 54
// Neutral colour (zero line, day separators, open price)
neuR = 120
neuG = 123
neuB = 134
atrDays = 500         // days in the average daily range (sets the height of separators and labels)
labelShift = 6        // bars to the right of the day start where the labels are centred
//--------------------------------------------------------------------//
// Timeframe check: intraday up to 4 hours
//--------------------------------------------------------------------//
isIntraday = GetTimeFrame <= 14400
//--------------------------------------------------------------------//
// Average daily range as a % of the daily open (last closed days)
//--------------------------------------------------------------------//
TIMEFRAME(daily, updateonclose)
once dCnt = 0
once dCum = 0
IF open > 0 THEN
   dRng = 100 * (high - low) / open
ELSE
   dRng = 0
ENDIF
dCnt = dCnt + 1
dCum = dCum + dRng
IF dCnt > atrDays THEN
   dailyATR = (dCum - dCum[atrDays]) / atrDays
ELSE
   // fewer days loaded than requested: average of all the days available
   dailyATR = dCum / dCnt
ENDIF
TIMEFRAME(default)
//--------------------------------------------------------------------//
// Percentage change from the daily open
//--------------------------------------------------------------------//
dOpenV = DOpen(0)
IF isIntraday AND dOpenV > 0 THEN
   pctChg = (close - dOpenV) / dOpenV * 100
ELSE
   pctChg = 0
ENDIF
isNewDay = 0
IF isIntraday AND barindex > 0 AND IntradayBarIndex = 0 THEN
   isNewDay = 1
ENDIF
//--------------------------------------------------------------------//
// Day records: start bar, open, range and final change of each day
//--------------------------------------------------------------------//
once nDays = 0
IF isNewDay THEN
   IF nDays > 0 THEN
      // the day that just ended closes with the change of its last bar
      $dPct[nDays] = pctChg[1]
   ENDIF
   nDays = nDays + 1
   $dStart[nDays] = barindex
   $dOpen[nDays] = dOpenV
   $dAtr[nDays] = dailyATR
ENDIF
//--------------------------------------------------------------------//
// Line and area colours
//--------------------------------------------------------------------//
IF pctChg > 0 THEN
   cR = posR
   cG = posG
   cB = posB
ELSE
   cR = negR
   cG = negG
   cB = negB
ENDIF
lineA = round(255 * (100 - outlineTransp) / 100)
areaA = round(255 * (100 - areaTransp) / 100)
zeroA = 255
// the first bar of each day breaks the line and the area
IF isIntraday = 0 OR isNewDay THEN
   lineA = 0
   areaA = 0
ENDIF
IF isIntraday = 0 THEN
   zeroA = 0
ENDIF
COLORBETWEEN(pctChg, 0, cR, cG, cB, areaA)
//--------------------------------------------------------------------//
// Day separators, open price and daily change labels
//--------------------------------------------------------------------//
IF islastbarupdate THEN
   IF isIntraday = 0 THEN
      DRAWTEXT("This is an intraday indicator. Please, switch to a lower timeframe.", 0, 0, SansSerif, Standard, 12) ANCHOR(MIDDLE, XSHIFT, YSHIFT) COLOURED(neuR, neuG, neuB, 255)
   ELSIF nDays > 0 THEN
      // dotted separators: the 500 most recent days
      kFirst = max(1, nDays - 499)
      FOR k = kFirst TO nDays DO
         yTop = 1.1 * $dAtr[k]
         DRAWSEGMENT($dStart[k], 0 - yTop, $dStart[k], yTop) STYLE(dottedline, 1) COLOURED(neuR, neuG, neuB, 255)
      NEXT
      // labels: the 250 most recent days (two labels per day)
      kFirst = max(1, nDays - 249)
      FOR k = kFirst TO nDays DO
         lx = $dStart[k] + labelShift
         opV = $dOpen[k]
         DRAWTEXT("Op:#opV#", lx, $dAtr[k], SansSerif, Standard, 10) COLOURED(neuR, neuG, neuB, 255)
         IF k = nDays THEN
            dayPct = pctChg
         ELSE
            dayPct = $dPct[k]
         ENDIF
         pctV = round(abs(dayPct) * 100) / 100
         ly = 0.75 * $dAtr[k]
         IF dayPct >= 0 THEN
            DRAWTEXT("▲+#pctV#%", lx, ly, SansSerif, Standard, 10) COLOURED(posR, posG, posB, 255)
         ELSE
            DRAWTEXT("▼-#pctV#%", lx, ly, SansSerif, Standard, 10) COLOURED(negR, negG, negB, 255)
         ENDIF
      NEXT
   ENDIF
ENDIF
//--------------------------------------------------------------------//
RETURN 0 COLOURED(neuR, neuG, neuB, zeroA) STYLE(dottedline, 1) AS "Zero Line", pctChg COLOURED(cR, cG, cB, lineA) STYLE(line, 2) AS "Plot"