







Ichimoku Follow Pattern
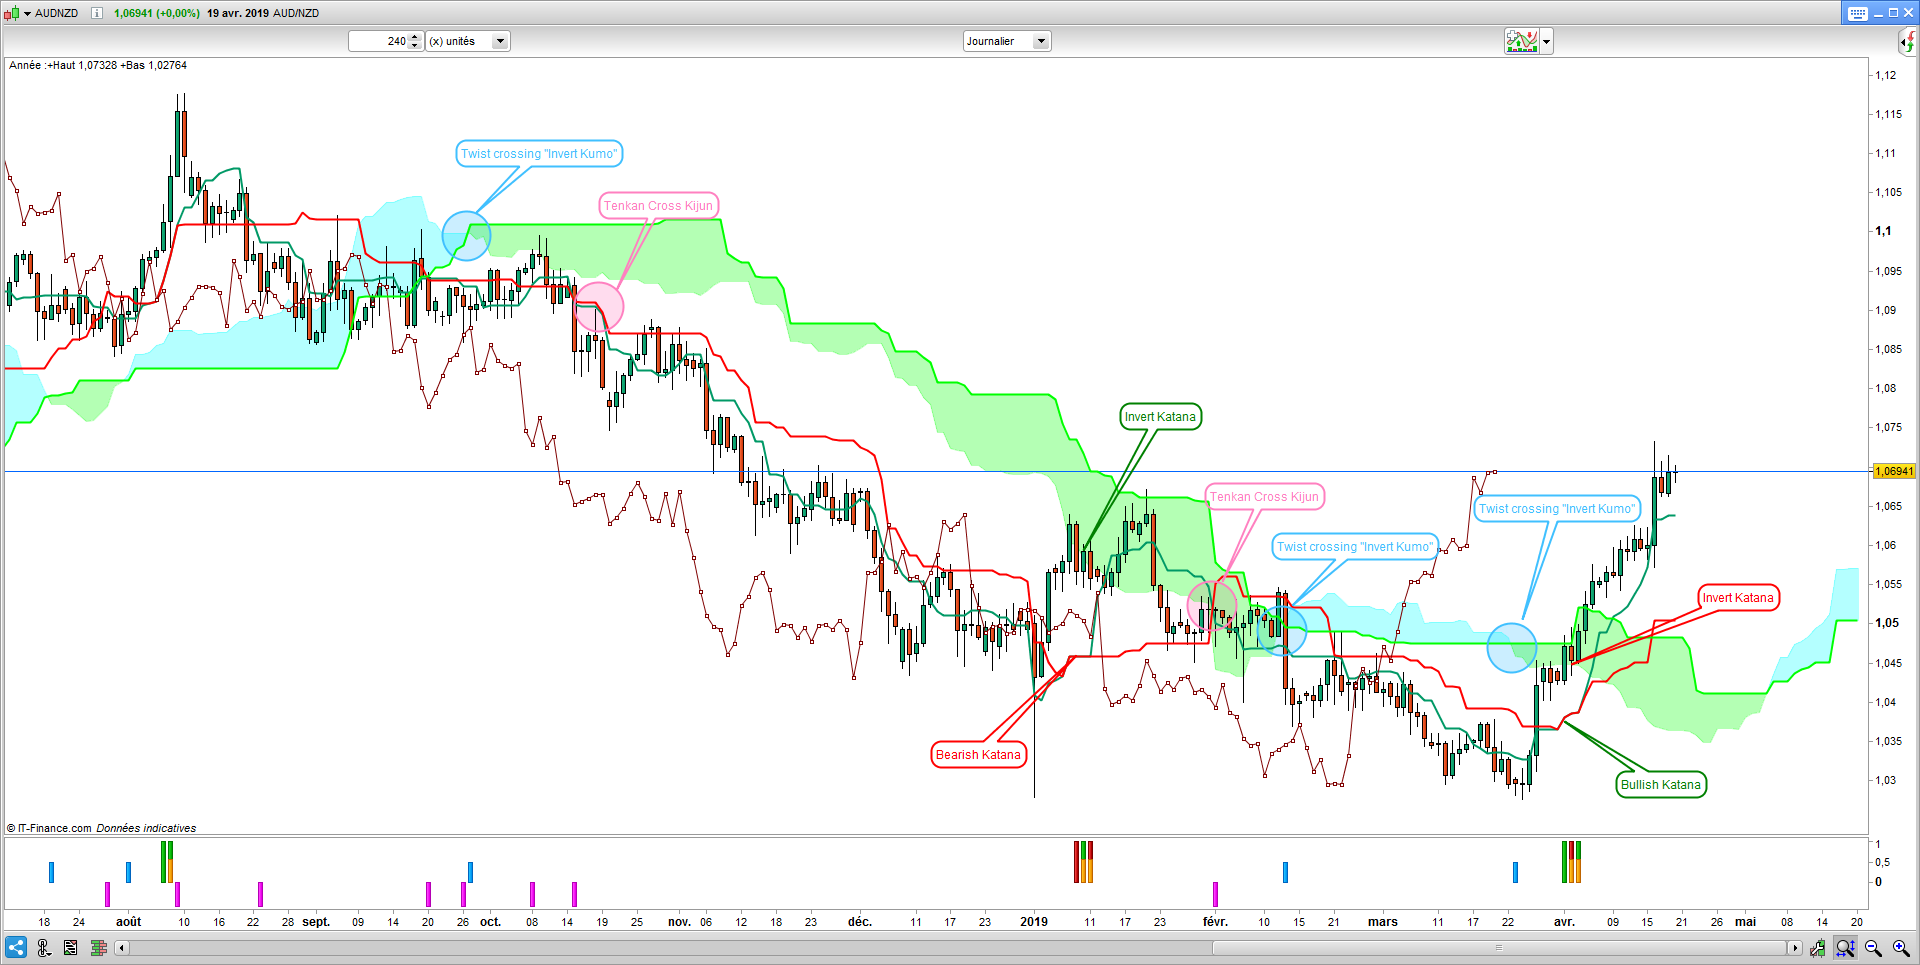
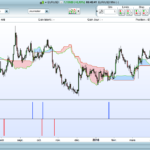
In the series of programs having their place under the price chart and following “Ichiba Kimochi Dashboard“, here is the indicator “Ichimoku Follow Pattern” grouping three figures often exploited by the system “Kinko Hyo” which visualizes the detected figures by bars in the form of histograms.
– Katana: Green in a Bullish start and Red if Bearish momentum
– Daisho: who is a figure translating a shortness of the Katana Orange color
– Tenkan / Kijun: Crossing the Tenkan-sen lines with the Kijun-sen Blue color
– Twist Cross: Change of orientation of the cloud by crossing Senkou SA with Senkou SB of Mauve color
These four variables can be exploited simultaneously or individually …
For any questions about the program “Ichiba Kimochi” please make your request here ► Ichimoku Follow Pattern
// Ichimoku Follow Patterns | Oscillator
// 21/04/2019 (Release 1.0)
// Swapping @ www.forexswap.fr
// Sharing ProRealTime knowledge (alt+16)

// --- Property settings
Katana = 1 //(1=true, 0=false)
Daisho = 1 //(1=true, 0=false)
Twist  = 1 //(1=true, 0=false)
TenKij =  1 //(1=true, 0=false)
// --- end

Tenkansen = (highest[9](high)+lowest[9](low))/2
Kijunsen  = (highest[26](high)+lowest[26](low))/2
SenkouSA  = (Tenkansen[26]+Kijunsen[26])/2
SenkouSB  = (highest[52](High[26])+lowest[52](Low[26]))/2

if katana then
 Pattern1 = summation[2](Tenkansen = Kijunsen) = 2        // Katana (2 candles follower)
endif
if daisho then
 Pattern2 = summation[3](Tenkansen = Kijunsen) = 3        // Daisho (3 candles follower)
endif
if twist then
 Pattern3 = SenkouSA crosses over SenkouSB or SenkouSA crosses under SenkouSB   // Twist crossing
endif
if tenkij then
 Pattern4 = Tenkansen crosses over Kijunsen or Tenkansen crosses under Kijunsen // Tenkan crossing Kijun
endif

if close > close[1] then // Katana bullish green
 r = 0
 g = 180
else                     // Katana bearish red
 r = 180
 g = 0
endif

return Pattern1/1 coloured(r,g,0) style(histogram,1) as"Katana", Pattern2/1.75 coloured(250,160,0) style(histogram,1)as"Daisho", Pattern3/2 coloured(0,160,250) style(histogram,1) as"Twist", Pattern4/-1.75 coloured(240,0,240) style(histogram,1) as"Ten/Kij"

Bonjour quibe56, n'ayant pas rencontré ce défaut je continu néanmoins à structurer le code pour qu'il soit plus pertinent concernant la visualisation de la figure et je proposerais d'autres versions dans le futur. Il faut comprendre que le code visualise un "signal" et que celui-ci doit être interprété non "seul" mais par rapport à d'autres éléments avant de lui donner une légitimité pour entrer sur le marché