






GreenStar ATR% Extension Monitor
Introduction
A stock trading 12 % above its 50-day moving average can be perfectly normal for a volatile growth name and a rare extreme for a utility. The distance in dollars or in percent says little until it is compared with how much that instrument usually moves. The GreenStar ATR% Extension Monitor, by FlyMe2, puts both readings in one panel: how volatile the instrument is, and how far price has stretched from its average measured in units of that volatility.
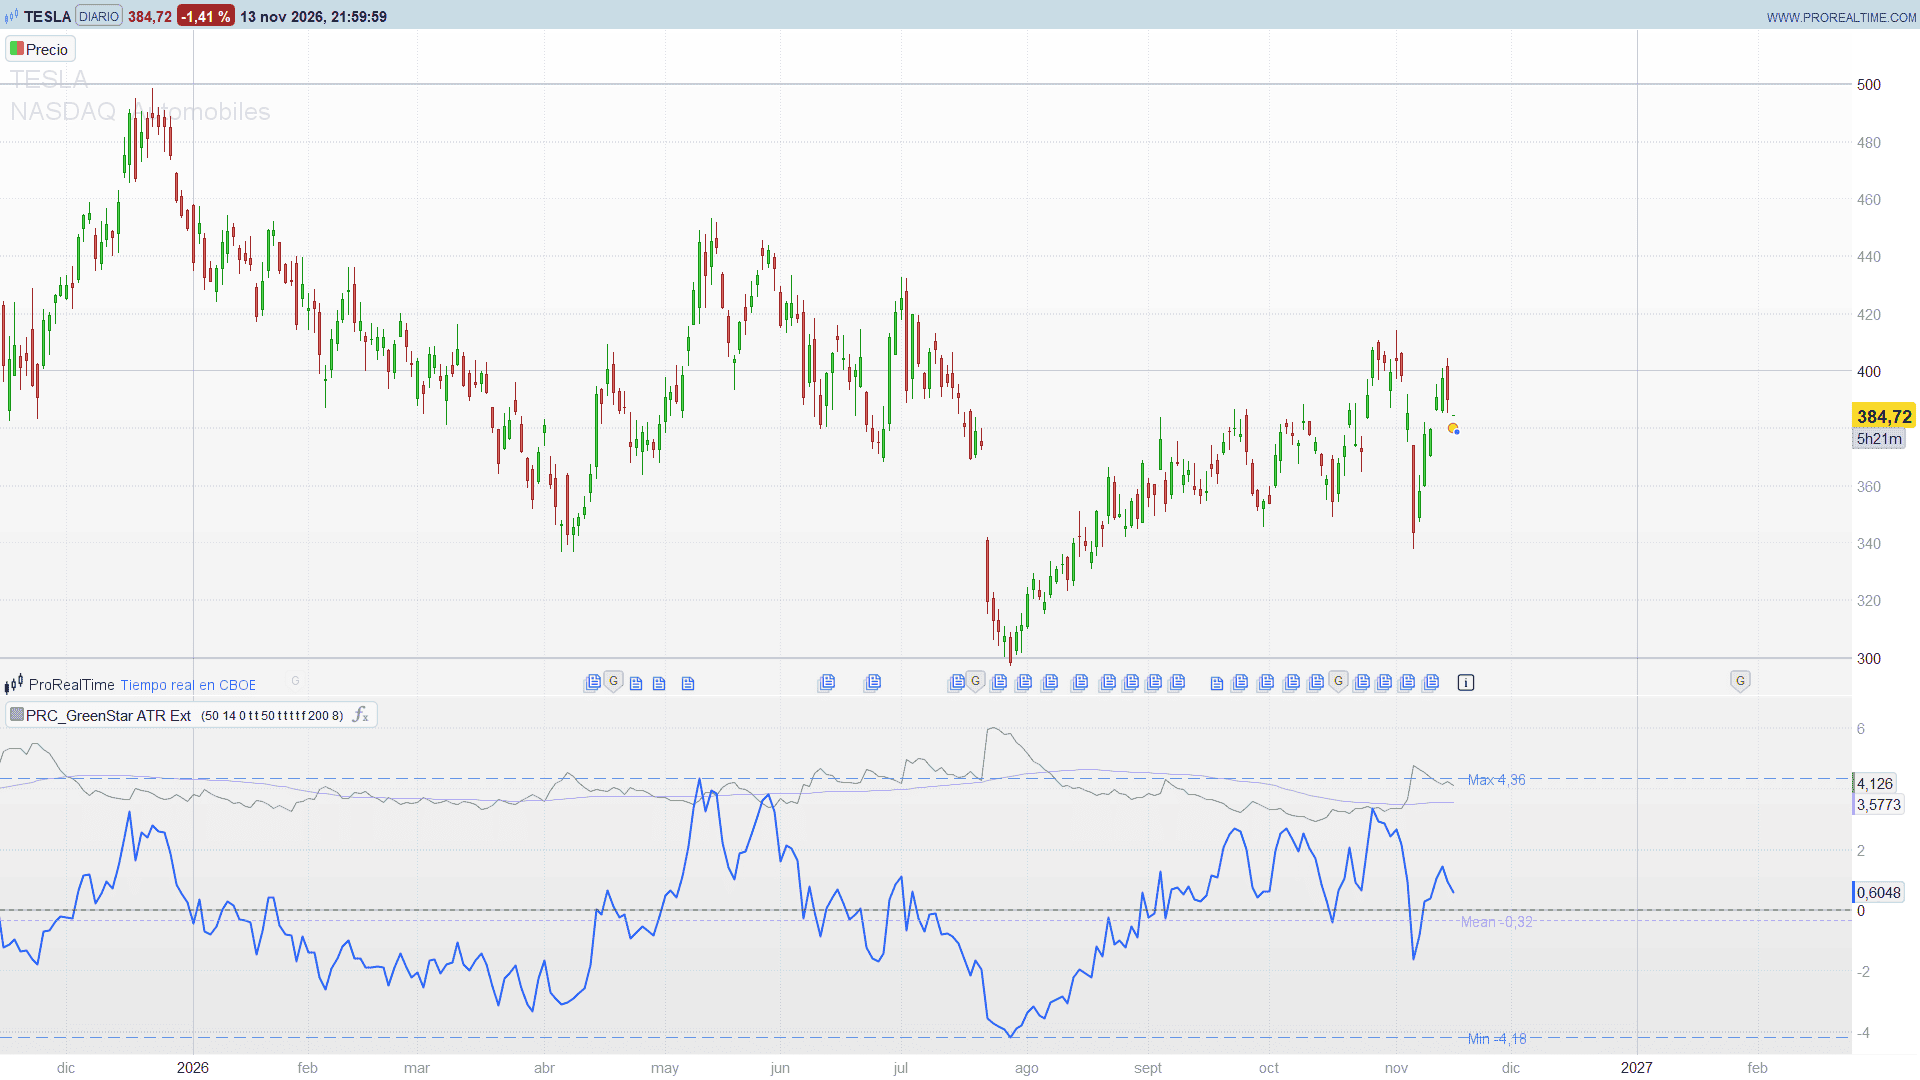
The result is a single number, xFromMA, that can be compared across instruments and across time, together with the highest, lowest and mean value it has reached on the bars you are looking at.
Theory Behind the Indicator
ATR%. The Average True Range (14 bars by default) divided by the close and multiplied by 100. It is the typical bar range as a percentage of price, so a 15-dollar stock and a 500-dollar stock can be compared directly. Its 50-bar simple average shows whether volatility is expanding or contracting against its own recent norm.
Percent from the average. The distance from the close to its moving average (50 bars, simple or exponential), as a percentage of the average.
xFromMA. The percent distance divided by ATR%. A reading of 6 means that price is six “typical bar ranges” above its average; a reading of -3, three below. Because the distance is scaled by the instrument’s own volatility, the number means the same thing on a quiet large cap and on a fast small cap.
Window statistics. On the last bar the indicator scans the most recent bars (200 by default) and draws the highest and the lowest xFromMA reached in that window, plus the mean. They tell you at a glance what “extended” has meant for this instrument: some names routinely stretch to 10 or 12 before reverting, others rarely clear 5.
Key Features at a Glance
- ATR as a percentage of price, with its own simple average.
- Extension multiple (xFromMA): percent distance from the moving average divided by ATR%.
- Dotted zero line: price sitting on its moving average.
- Highest, lowest and mean xFromMA of the window, as dashed lines with their values printed on the right.
- Optional highest and lowest ATR% of the same window.
- SMA or EMA as the reference average.
How to Read the Indicator
- xFromMA above zero: price is above its average; below zero, under it. The further from zero, the more stretched.
- xFromMA near the Max line: the extension is as large as anything seen in the window. It is not a sell signal on its own, but it is where late entries carry the worst risk and where partial profits are usually considered.
- xFromMA near the Min line: the mirror case on the downside.
- Mean line well above zero: the instrument has spent the window trending above its average; pullbacks to the mean line, rather than to zero, have been the normal reset.
- ATR% above its average: volatility is expanding. The same xFromMA reading then corresponds to a larger percent move.
Practical Applications
- Avoid chasing: before buying a breakout, check how many ATR% units price already is from its average and how that compares with the Max of the window.
- Scaling out: use the historical Max zone of each instrument as an area to reduce, instead of a fixed percentage that ignores volatility.
- Comparing candidates: two stocks 10 % above their average are not equally extended; xFromMA ranks them on the same scale.
- Mean reversion: readings beyond the usual Min or Max, with ATR% above its average, mark the stretches from which snap-backs tend to start.
Scroll the window length to the amount of history you want to judge against: 200 daily bars is roughly ten months.
Indicator Configuration
- maPeriod (default 50): moving average period.
- atrPeriod (default 14): ATR period.
- maType (default 0): 0 = simple, 1 = exponential.
- showAtr (default 1): show the ATR% line.
- showAtrAvg (default 1): show the average of ATR%.
- atrAvgPeriod (default 50): bars used to average ATR%.
- showExt (default 1): show the xFromMA line.
- showZero (default 1): dotted line at zero.
- showExtRange (default 1): highest and lowest xFromMA of the window.
- showExtMean (default 1): mean xFromMA of the window (needs showExtRange).
- showAtrRange (default 0): highest and lowest ATR% of the window.
- visibleBars (default 200): number of bars of the window, counted back from the last bar. Set it to the number of bars you keep on screen.
- labelShift (default 8): bars to the right of the last bar where the values are printed.
The Code
//---------------------------------------------------------------
// PRC_GreenStar ATR Ext
// version = 0
// 16.11.2026
// Iván González @ www.prorealcode.com
// Author: FlyMe2
// Sharing ProRealTime knowledge
//--------------------------------------------------------------------//
defparam drawonlastbaronly = true
//--------------------------------------------------------------------//
// INPUTS
//--------------------------------------------------------------------//
maPeriod = 50          // moving average period
atrPeriod = 14         // ATR period
maType = 0             // 0 = SMA, 1 = EMA
showAtr = 1            // ATR% line (1 = on, 0 = off)
showAtrAvg = 1         // simple average of the ATR% line
atrAvgPeriod = 50      // bars used to average ATR%
showExt = 1            // xFromMA line (extension multiple)
showZero = 1           // dotted line at xFromMA = 0 (price on its average)
showExtRange = 1       // highest / lowest xFromMA of the window
showExtMean = 1        // mean xFromMA of the window (needs showExtRange = 1)
showAtrRange = 0       // highest / lowest ATR% of the window
visibleBars = 200      // window: the bars you keep on screen, ending on the last bar
labelShift = 8         // bars to the right of the last bar for the value labels
//--------------------------------------------------------------------//
// ATR% AND EXTENSION MULTIPLE
//--------------------------------------------------------------------//
maV = average[maPeriod, maType](close)
atrV = averagetruerange[atrPeriod](close)
atrPct = atrV / close * 100
atrPctAvg = average[atrAvgPeriod](atrPct)
maGain = (close - maV) / maV * 100
// percent distance from the average, measured in ATR% units
IF atrPct > 0 THEN
   xFromMA = maGain / atrPct
ELSE
   xFromMA = xFromMA[1]
ENDIF
//--------------------------------------------------------------------//
// LINE VISIBILITY (alpha 0 hides a line without removing its values)
//--------------------------------------------------------------------//
atrA = 217 * showAtr
avgA = 166 * showAtrAvg
extA = 255 * showExt
//--------------------------------------------------------------------//
// WINDOW STATISTICS (recomputed on the last bar)
//--------------------------------------------------------------------//
IF islastbarupdate THEN
   IF showZero = 1 THEN
      DRAWHLINE(0) COLOURED(120, 123, 134, 166) STYLE(dottedline, 2)
   ENDIF
   warm = max(maPeriod, atrPeriod) + 1
   nVis = min(visibleBars, barindex - warm + 1)
   IF nVis >= 1 THEN
      extHi = xFromMA
      extLo = xFromMA
      extSum = 0
      atrHi = atrPct
      atrLo = atrPct
      FOR i = 0 TO nVis - 1 DO
         extHi = max(extHi, xFromMA[i])
         extLo = min(extLo, xFromMA[i])
         extSum = extSum + xFromMA[i]
         atrHi = max(atrHi, atrPct[i])
         atrLo = min(atrLo, atrPct[i])
      NEXT
      extMean = extSum / nVis
      xLab = barindex + labelShift
      // two-decimal copies for the labels
      hiTxt = round(extHi * 100) / 100
      loTxt = round(extLo * 100) / 100
      meanTxt = round(extMean * 100) / 100
      atrHiTxt = round(atrHi * 100) / 100
      atrLoTxt = round(atrLo * 100) / 100
      IF showExtRange = 1 THEN
         DRAWHLINE(extHi) COLOURED(60, 130, 220, 200) STYLE(dottedline2, 1)
         DRAWHLINE(extLo) COLOURED(60, 130, 220, 200) STYLE(dottedline2, 1)
         DRAWTEXT("Max #hiTxt#", xLab, extHi) COLOURED(60, 130, 220, 255)
         DRAWTEXT("Min #loTxt#", xLab, extLo) COLOURED(60, 130, 220, 255)
         IF showExtMean = 1 THEN
            DRAWHLINE(extMean) COLOURED(192, 132, 252, 200) STYLE(dottedline, 1)
            DRAWTEXT("Mean #meanTxt#", xLab, extMean) COLOURED(192, 132, 252, 255)
         ENDIF
      ENDIF
      IF showAtrRange = 1 THEN
         DRAWHLINE(atrHi) COLOURED(90, 160, 90, 200) STYLE(dottedline2, 1)
         DRAWHLINE(atrLo) COLOURED(90, 160, 90, 200) STYLE(dottedline2, 1)
         DRAWTEXT("Max% #atrHiTxt#", xLab, atrHi) COLOURED(90, 160, 90, 255)
         DRAWTEXT("Min% #atrLoTxt#", xLab, atrLo) COLOURED(90, 160, 90, 255)
      ENDIF
   ENDIF
ENDIF
//--------------------------------------------------------------------//
RETURN atrPct COLOURED(85, 136, 85, atrA) STYLE(line, 1) AS "ATR%", atrPctAvg COLOURED(192, 132, 252, avgA) STYLE(line, 1) AS "ATR% average", xFromMA COLOURED(41, 98, 255, extA) STYLE(line, 2) AS "xFromMA"