







First Passage Time
Introduction
Most volatility tools answer the question “how far can price go?”. Traders usually care about a different one: “how long will it take to get there, and which side is likely to be reached first?”. A 5% target is not the same trade if it is typically reached in two days or in three weeks, and a stop placed 5% away matters very differently if the market tends to hit the downside first.
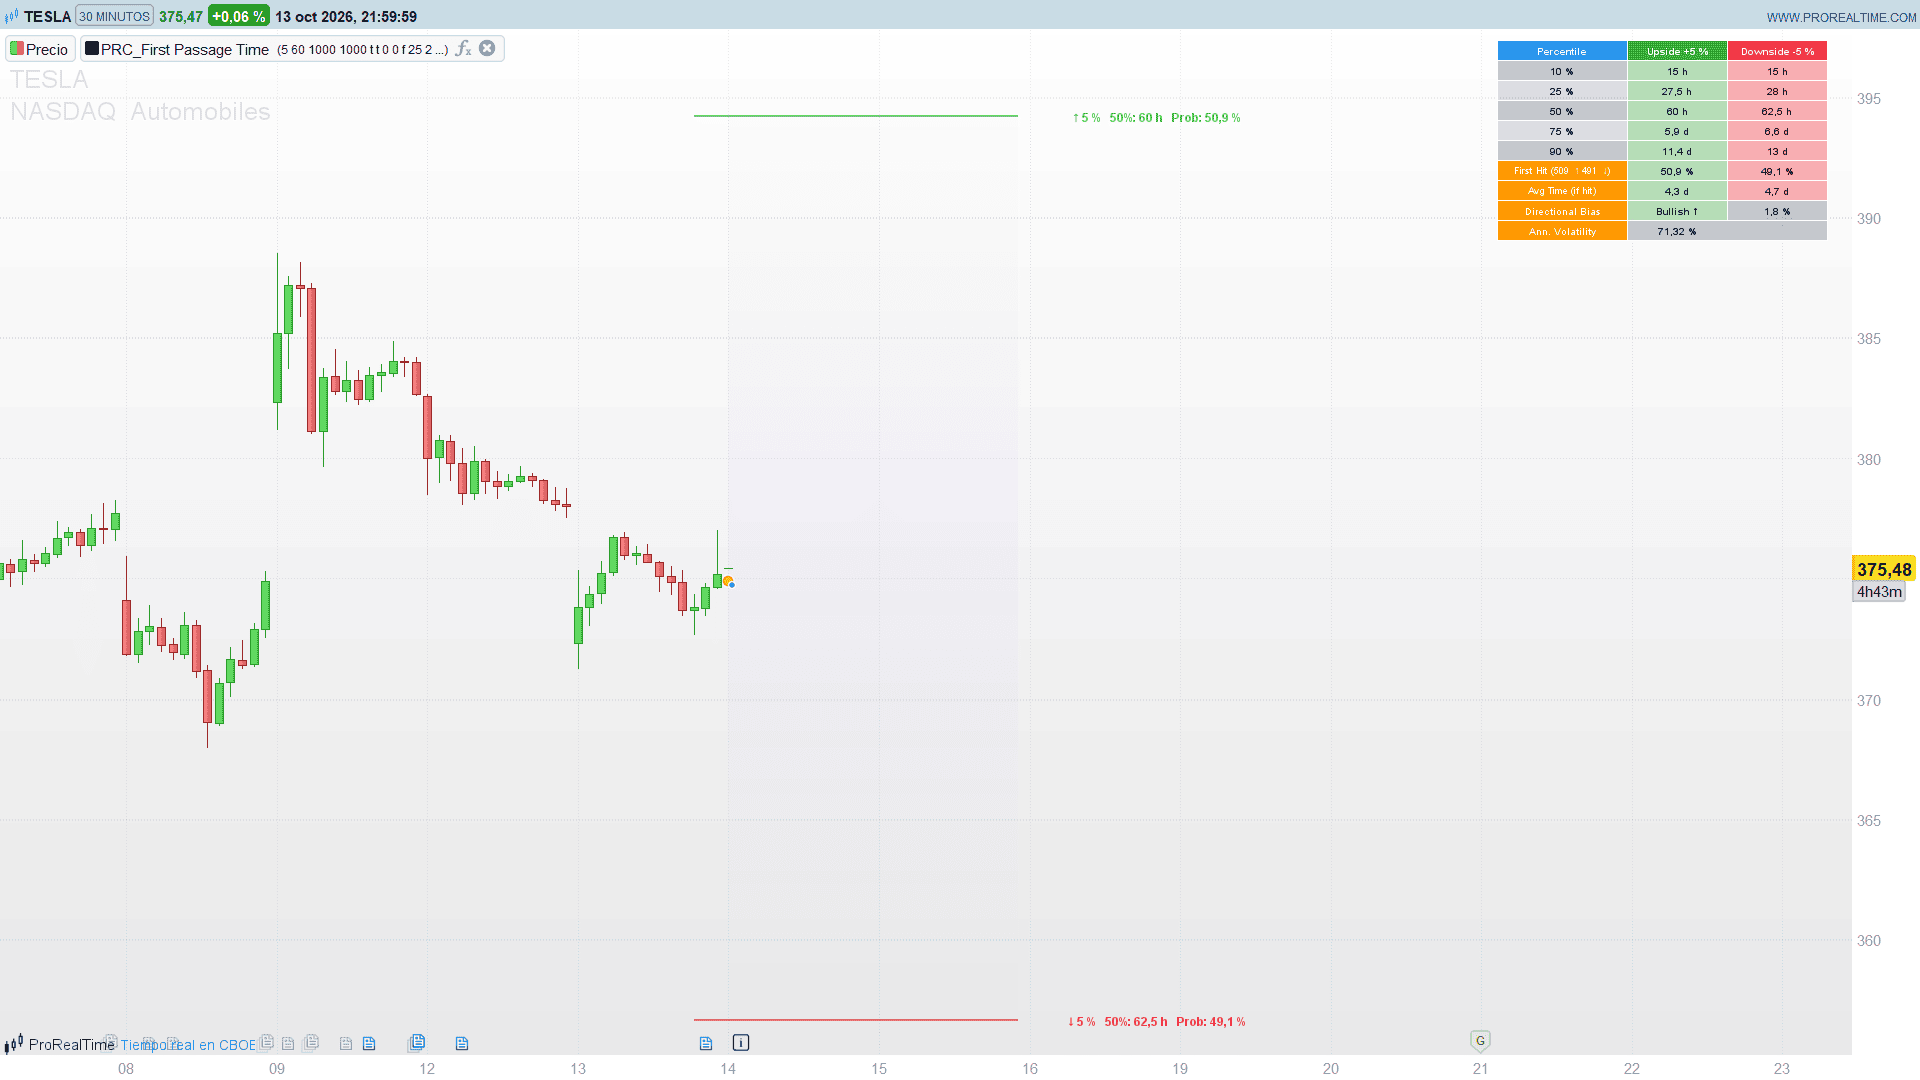
First Passage Time answers exactly that. On the last bar it places two thresholds, X% above and X% below the current close, and runs a Monte Carlo simulation to estimate the distribution of the time needed to touch each one for the first time, the probability that each side is touched first, and the average waiting time. Everything is expressed in minutes, hours or days according to the chart timeframe.
Theory Behind the Indicator
The “first passage time” is a classic concept from probability theory: the first moment a random process reaches a given level. For a price following a geometric Brownian motion it depends on three things: the distance to the level, the volatility and the drift.
The indicator measures volatility as the standard deviation of the log returns over the last 60 bars, and the drift as their average. Each simulated path starts at the current close and moves step by step with a lognormal shock:
price(t) = price(t-1) * exp(drift – 0.5 * sigma^2 + sigma * z)
where z is a standard normal draw. Each path stops when it has touched both thresholds or when it reaches the maximum number of periods. For every path the indicator records when the upper level was hit, when the lower level was hit, and which one came first. With 1,000 paths, the percentiles of those times describe the whole distribution, not just an average.
Because the barriers are path-dependent (what matters is the first touch, not where price ends up), there is no simple shortcut: the simulation really has to walk every path. The random numbers come from a Wichmann-Hill generator with a fixed seed, so the result is stable from tick to tick and reproducible; change the seed to draw a different sample.
Key Features at a Glance
- Monte Carlo of up to 2,000 price paths with the volatility and drift of the chart itself.
- Percentile table (10, 25, 50, 75, 90) of the first passage time for both thresholds, or a sigma view (2σ and 1σ) with a theoretical minimum.
- First hit rate: share of paths that touch the upside or the downside first, with a directional bias.
- Average time to reach each level when it is reached.
- Annualised volatility, and optional annualised drift and drift mode.
- Three drift modes: historical, zero (neutral) and 50% reduced.
- Threshold lines, gradient risk zones and labels with the median time and the first-hit probability.
- Times shown in minutes, hours or days depending on the timeframe.
How to Read the Indicator
The green line is the upside threshold and the red line the downside one. The label next to each line shows the threshold, the median time to reach it (half of the paths need less than that) and the probability that this side is touched first.
The table spreads the distribution: the 10% row is a fast scenario, the 90% row a slow one. A narrow gap between them means the timing is fairly predictable for that distance; a wide gap means patience may be needed. The First Hit row compares both sides directly: with zero drift both should be close to 50%, so any clear imbalance comes from the measured trend.
Two things are worth keeping in mind when reading those numbers. First, the drift is the average log return of the last volPeriod bars, which is simply the net change from the close volPeriod bars ago to the current one, divided by volPeriod. The Directional Bias therefore reflects that single net move, and it is very sensitive to it: on a 30-minute chart with a 5% threshold, a net fall of 0.16% over the last 60 bars is enough to move the first-hit rate from 50% to about 47.5%. Second, the table is a Monte Carlo sample. With 1,000 paths the first-hit rate carries a sampling noise of roughly ±3 points and the percentile times of around ±10 to 12%, so a different seed gives slightly different figures. The fixed seed keeps the reading stable from tick to tick; changing it shows how much of a given reading is noise.
If the table shows “Low Hit Rate”, fewer than 90% of the paths reached any threshold within the maximum number of periods. Increase maxPeriods or reduce thresholdPct.
Practical Applications
- Target and stop planning: check whether a profit target is realistic within the holding period you have in mind.
- Options and time-limited trades: compare the median time with the time left before expiry.
- Drift sensitivity: switch the drift mode to zero to see how much of the directional bias comes from the recent trend and how much from volatility alone.
- Position sizing: wide and slow distributions call for smaller size or more patience than tight and fast ones.
Keep in mind that the model assumes constant volatility and normally distributed returns. Real markets have volatility clusters and fat tails, so treat the numbers as a baseline, not as a forecast.
Indicator Configuration
- thresholdPct (default 5.0): distance of both thresholds from the current close, in percent.
- volPeriod (default 60): bars used to measure volatility and drift.
- numSims (default 1000): number of simulated paths (500 to 2000). More paths give smoother results and more calculation time.
- maxPeriods (default 1000): maximum length of each path, in bars.
- showZones (default 1): gradient risk zones between the close and each threshold.
- showLabels (default 1): labels at the end of the threshold lines.
- distType (default 0): 0 shows the percentile table, 1 the sigma table with the theoretical minimum.
- driftMode (default 0): 0 historical drift, 1 zero drift, 2 drift reduced by 50%.
- showDiag (default 0): adds the annualised drift and the drift mode to the table.
- projBars (default 25): length of the threshold lines and zones to the right, in bars.
- labelSize (default 2): label size, from 0 (tiny) to 4 (huge).
- labelShift (default 12): distance in bars between the end of the lines and the centre of the labels.
- seed (default 1): seed of the random generator. The same seed always gives the same result.
- dashX / dashY (defaults -90 / -20): position of the table in pixels from the top-right corner. If the table touches the price scale, make dashX more negative.
The Code
//---------------------------------------------------------------
// PRC_First Passage Time
// version = 0
// 14.10.2026
// Iván González @ www.prorealcode.com
// Author: Henrique Centieiro
// Sharing ProRealTime knowledge
//--------------------------------------------------------------------//
defparam drawonlastbaronly = true
//----------------------------------------------
// === INPUTS ===
//----------------------------------------------
thresholdPct = 5.0      // Threshold % above and below the current price
volPeriod = 60          // Volatility lookback period (bars)
numSims = 1000          // Monte Carlo simulations (500-2000)
maxPeriods = 1000       // Maximum periods simulated per path (100-5000)
showZones = 1           // 1 = gradient risk zones
showLabels = 1          // 1 = labels at the end of the threshold lines
distType = 0            // 0 = Percentile table, 1 = Sigma table
driftMode = 0           // 0 = Historical drift, 1 = Zero (neutral), 2 = 50% reduced
showDiag = 0            // 1 = show annualised drift and drift mode
projBars = 25           // Length of the projection to the right (bars)
labelSize = 2           // Label size: 0 tiny, 1 small, 2 normal, 3 large, 4 huge
labelShift = 12         // Bars between the end of the lines and the centre of the labels
seed = 1                // Seed of the random generator (same seed = same result)
// Table position, in pixels from the top-right corner of the window
dashX = -90             // right edge of the table
dashY = -20             // centre of the first row
//----------------------------------------------
// === RETURNS, VOLATILITY AND DRIFT ===
//----------------------------------------------
IF barindex > 0 THEN
   ret = log(close / close[1])
ELSE
   ret = 0
ENDIF
volat = std[volPeriod](ret)
driftRaw = average[volPeriod](ret)

IF driftMode = 1 THEN
   drift = 0
ELSIF driftMode = 2 THEN
   drift = driftRaw * 0.5
ELSE
   drift = driftRaw
ENDIF

// chart timeframe in minutes (GetTimeFrame returns seconds)
tfMin = GetTimeFrame / 60
IF tfMin <= 0 THEN
   tfMin = 1
ENDIF
//----------------------------------------------
// === EVERYTHING BELOW RUNS ON THE LAST BAR ===
//----------------------------------------------
IF islastbarupdate AND barindex > volPeriod AND volat > 0 THEN
   curPrice = close
   upThr = curPrice * (1 + thresholdPct / 100)
   dnThr = curPrice * (1 - thresholdPct / 100)
   driftComp = drift - 0.5 * volat * volat

   // --- histograms of the first passage time of each barrier (periods 1..maxPeriods)
   FOR t = 0 TO maxPeriods DO
      $upH[t] = 0
      $dnH[t] = 0
   NEXT

   // --- Wichmann-Hill random generator: three small congruential generators,
   // exact in floating point, period close to 7e12
   s1 = 1 + ((seed * 7919) MOD 30268)
   s2 = 1 + ((seed * 104729) MOD 30306)
   s3 = 1 + ((seed * 1299709) MOD 30322)

   upFirst = 0
   dnFirst = 0
   upSum = 0
   dnSum = 0
   upCnt = 0
   dnCnt = 0

   FOR sim = 1 TO numSims DO
      simP = curPrice
      upHit = 0
      dnHit = 0
      upTime = 0
      dnTime = 0
      per = 1
      WHILE per <= maxPeriods AND (upHit = 0 OR dnHit = 0) DO
         s1 = (171 * s1) MOD 30269
         s2 = (172 * s2) MOD 30307
         s3 = (170 * s3) MOD 30323
         uu = s1 / 30269 + s2 / 30307 + s3 / 30323
         u1 = uu - floor(uu)
         s1 = (171 * s1) MOD 30269
         s2 = (172 * s2) MOD 30307
         s3 = (170 * s3) MOD 30323
         uu = s1 / 30269 + s2 / 30307 + s3 / 30323
         u2 = uu - floor(uu)
         IF u1 < 0.0001 THEN
            u1 = 0.0001
         ENDIF
         // Box-Muller normal draw (COS works in degrees in ProBuilder)
         zz = sqrt(-2 * log(u1)) * cos(360 * u2)
         simP = simP * exp(driftComp + volat * zz)
         IF upHit = 0 AND simP >= upThr THEN
            upHit = 1
            upTime = per
         ENDIF
         IF dnHit = 0 AND simP <= dnThr THEN
            dnHit = 1
            dnTime = per
         ENDIF
         per = per + 1
      WEND

      // which barrier was hit first (a tie counts for neither)
      IF upHit = 1 AND dnHit = 1 THEN
         IF upTime < dnTime THEN
            upFirst = upFirst + 1
         ELSIF dnTime < upTime THEN
            dnFirst = dnFirst + 1
         ENDIF
      ELSIF upHit = 1 THEN
         upFirst = upFirst + 1
      ELSIF dnHit = 1 THEN
         dnFirst = dnFirst + 1
      ENDIF

      IF upHit = 1 THEN
         $upH[upTime] = $upH[upTime] + 1
         upSum = upSum + upTime
         upCnt = upCnt + 1
      ENDIF
      IF dnHit = 1 THEN
         $dnH[dnTime] = $dnH[dnTime] + 1
         dnSum = dnSum + dnTime
         dnCnt = dnCnt + 1
      ENDIF
   NEXT

   upMeanOk = 0
   upMean = 0
   IF upCnt > 0 THEN
      upMeanOk = 1
      upMean = upSum / upCnt
   ENDIF
   dnMeanOk = 0
   dnMean = 0
   IF dnCnt > 0 THEN
      dnMeanOk = 1
      dnMean = dnSum / dnCnt
   ENDIF

   //----------------------------------------------
   // === PERCENTILES OF THE FIRST PASSAGE TIMES ===
   // Sorted sample read at index floor(n * pct / 100); with integer times the
   // sorted sample is the histogram, so the value at that index is the first
   // time whose cumulative count goes past it.
   // Slots: 0..4 upside rows, 5..9 downside rows, 10/11 upside/downside median
   //----------------------------------------------
   IF distType = 0 THEN
      nRows = 5
      $pctL[0] = 10
      $pctL[1] = 25
      $pctL[2] = 50
      $pctL[3] = 75
      $pctL[4] = 90
   ELSE
      nRows = 2
      $pctL[0] = 2.28
      $pctL[1] = 15.87
   ENDIF
   FOR k = 0 TO nRows - 1 DO
      $qPct[k] = $pctL[k]
      $qPct[k + 5] = $pctL[k]
   NEXT
   $qPct[10] = 50
   $qPct[11] = 50

   FOR k = 0 TO 11 DO
      $qOk[k] = 0
      $qVal[k] = 0
      IF k < nRows OR (k >= 5 AND k < 5 + nRows) OR k >= 10 THEN
         IF k < 5 OR k = 10 THEN
            nVal = upCnt
         ELSE
            nVal = dnCnt
         ENDIF
         IF $qPct[k] < 1 THEN
            needN = 10
         ELSE
            needN = 5
         ENDIF
         IF nVal >= needN THEN
            idx = floor(nVal * $qPct[k] / 100)
            idx = min(max(idx, 0), nVal - 1)
            cum = 0
            tq = 0
            WHILE cum <= idx AND tq < maxPeriods DO
               tq = tq + 1
               IF k < 5 OR k = 10 THEN
                  cum = cum + $upH[tq]
               ELSE
                  cum = cum + $dnH[tq]
               ENDIF
            WEND
            $qOk[k] = 1
            $qVal[k] = tq
         ENDIF
      ENDIF
   NEXT

   //----------------------------------------------
   // === TIME FORMAT (minutes / hours / days) ===
   // Slots 0..11 as above, 12/13 theoretical minimum, 14/15 average time
   //----------------------------------------------
   theo = (thresholdPct / 100) / (volat * 3)
   $qOk[12] = 1
   $qVal[12] = theo
   $qOk[13] = 1
   $qVal[13] = theo
   $qOk[14] = upMeanOk
   $qVal[14] = upMean
   $qOk[15] = dnMeanOk
   $qVal[15] = dnMean

   FOR k = 0 TO 15 DO
      IF $qOk[k] = 0 THEN
         $fU[k] = 0 - 1
         $fN[k] = 0
      ELSE
         totMin = $qVal[k] * tfMin
         IF totMin < 120 THEN
            $fU[k] = 0
            $fN[k] = round(totMin)
         ELSIF totMin < 5760 THEN
            $fU[k] = 1
            $fN[k] = round(totMin / 60 * 10) / 10
         ELSE
            $fU[k] = 2
            $fN[k] = round(totMin / 1440 * 10) / 10
         ENDIF
      ENDIF
   NEXT

   totalFirst = upFirst + dnFirst
   IF totalFirst > 0 THEN
      upRate = upFirst / totalFirst * 100
      dnRate = dnFirst / totalFirst * 100
   ELSE
      upRate = 0
      dnRate = 0
   ENDIF

   //----------------------------------------------
   // === THRESHOLD LINES ===
   //----------------------------------------------
   DRAWSEGMENT(barindex - 3, upThr, barindex + projBars, upThr) COLOURED(76, 175, 80, 178) STYLE(line, 2)
   DRAWSEGMENT(barindex - 3, dnThr, barindex + projBars, dnThr) COLOURED(242, 54, 69, 178) STYLE(line, 2)

   //----------------------------------------------
   // === GRADIENT RISK ZONES (10 layers each side) ===
   //----------------------------------------------
   IF showZones = 1 THEN
      layH = (upThr - close) / 10
      dlayH = (close - dnThr) / 10
      FOR i = 0 TO 9 DO
         ratio = i / 9
         zr = round(220 * (1 - ratio) + 190 * ratio)
         zg = round(190 * (1 - ratio) + 210 * ratio)
         zTr = 90 + round(i * 0.7)
         za = round(255 * (100 - zTr) / 100)
         DRAWRECTANGLE(barindex, close + layH * i, barindex + projBars, close + layH * (i + 1)) COLOURED(zr, zg, 255, 0) FILLCOLOR(zr, zg, 255, za)
         DRAWRECTANGLE(barindex, close - dlayH * i, barindex + projBars, close - dlayH * (i + 1)) COLOURED(zr, zg, 255, 0) FILLCOLOR(zr, zg, 255, za)
      NEXT
   ENDIF

   //----------------------------------------------
   // === LABELS (threshold, median time, probability of being hit first) ===
   //----------------------------------------------
   IF showLabels = 1 THEN
      lblX = barindex + projBars + labelShift
      thrTxt = round(thresholdPct * 10) / 10
      upProb = round(upRate * 10) / 10
      dnProb = round(dnRate * 10) / 10
      uMed = $fN[10]
      dMed = $fN[11]
      FOR side = 0 TO 1 DO
         IF side = 0 THEN
            lu = $fU[10]
            ly = upThr
            lr = 76
            lg = 175
            lb = 80
         ELSE
            lu = $fU[11]
            ly = dnThr
            lr = 242
            lg = 54
            lb = 69
         ENDIF
         IF labelSize = 0 THEN
            lfs = 8
         ELSIF labelSize = 1 THEN
            lfs = 10
         ELSIF labelSize = 3 THEN
            lfs = 14
         ELSIF labelSize = 4 THEN
            lfs = 18
         ELSE
            lfs = 12
         ENDIF
         IF side = 0 THEN
            IF lu = 0 THEN
               IF lfs = 8 THEN
                  DRAWTEXT("↑ #thrTxt#%   50%: #uMed#m   Prob: #upProb#%", lblX, ly, sansserif, bold, 8) COLOURED(lr, lg, lb, 230)
               ELSIF lfs = 10 THEN
                  DRAWTEXT("↑ #thrTxt#%   50%: #uMed#m   Prob: #upProb#%", lblX, ly, sansserif, bold, 10) COLOURED(lr, lg, lb, 230)
               ELSIF lfs = 14 THEN
                  DRAWTEXT("↑ #thrTxt#%   50%: #uMed#m   Prob: #upProb#%", lblX, ly, sansserif, bold, 14) COLOURED(lr, lg, lb, 230)
               ELSIF lfs = 18 THEN
                  DRAWTEXT("↑ #thrTxt#%   50%: #uMed#m   Prob: #upProb#%", lblX, ly, sansserif, bold, 18) COLOURED(lr, lg, lb, 230)
               ELSE
                  DRAWTEXT("↑ #thrTxt#%   50%: #uMed#m   Prob: #upProb#%", lblX, ly, sansserif, bold, 12) COLOURED(lr, lg, lb, 230)
               ENDIF
            ELSIF lu = 1 THEN
               IF lfs = 8 THEN
                  DRAWTEXT("↑ #thrTxt#%   50%: #uMed#h   Prob: #upProb#%", lblX, ly, sansserif, bold, 8) COLOURED(lr, lg, lb, 230)
               ELSIF lfs = 10 THEN
                  DRAWTEXT("↑ #thrTxt#%   50%: #uMed#h   Prob: #upProb#%", lblX, ly, sansserif, bold, 10) COLOURED(lr, lg, lb, 230)
               ELSIF lfs = 14 THEN
                  DRAWTEXT("↑ #thrTxt#%   50%: #uMed#h   Prob: #upProb#%", lblX, ly, sansserif, bold, 14) COLOURED(lr, lg, lb, 230)
               ELSIF lfs = 18 THEN
                  DRAWTEXT("↑ #thrTxt#%   50%: #uMed#h   Prob: #upProb#%", lblX, ly, sansserif, bold, 18) COLOURED(lr, lg, lb, 230)
               ELSE
                  DRAWTEXT("↑ #thrTxt#%   50%: #uMed#h   Prob: #upProb#%", lblX, ly, sansserif, bold, 12) COLOURED(lr, lg, lb, 230)
               ENDIF
            ELSIF lu = 2 THEN
               IF lfs = 8 THEN
                  DRAWTEXT("↑ #thrTxt#%   50%: #uMed#d   Prob: #upProb#%", lblX, ly, sansserif, bold, 8) COLOURED(lr, lg, lb, 230)
               ELSIF lfs = 10 THEN
                  DRAWTEXT("↑ #thrTxt#%   50%: #uMed#d   Prob: #upProb#%", lblX, ly, sansserif, bold, 10) COLOURED(lr, lg, lb, 230)
               ELSIF lfs = 14 THEN
                  DRAWTEXT("↑ #thrTxt#%   50%: #uMed#d   Prob: #upProb#%", lblX, ly, sansserif, bold, 14) COLOURED(lr, lg, lb, 230)
               ELSIF lfs = 18 THEN
                  DRAWTEXT("↑ #thrTxt#%   50%: #uMed#d   Prob: #upProb#%", lblX, ly, sansserif, bold, 18) COLOURED(lr, lg, lb, 230)
               ELSE
                  DRAWTEXT("↑ #thrTxt#%   50%: #uMed#d   Prob: #upProb#%", lblX, ly, sansserif, bold, 12) COLOURED(lr, lg, lb, 230)
               ENDIF
            ELSE
               IF lfs = 8 THEN
                  DRAWTEXT("↑ #thrTxt#%   50%: N/A   Prob: #upProb#%", lblX, ly, sansserif, bold, 8) COLOURED(lr, lg, lb, 230)
               ELSIF lfs = 10 THEN
                  DRAWTEXT("↑ #thrTxt#%   50%: N/A   Prob: #upProb#%", lblX, ly, sansserif, bold, 10) COLOURED(lr, lg, lb, 230)
               ELSIF lfs = 14 THEN
                  DRAWTEXT("↑ #thrTxt#%   50%: N/A   Prob: #upProb#%", lblX, ly, sansserif, bold, 14) COLOURED(lr, lg, lb, 230)
               ELSIF lfs = 18 THEN
                  DRAWTEXT("↑ #thrTxt#%   50%: N/A   Prob: #upProb#%", lblX, ly, sansserif, bold, 18) COLOURED(lr, lg, lb, 230)
               ELSE
                  DRAWTEXT("↑ #thrTxt#%   50%: N/A   Prob: #upProb#%", lblX, ly, sansserif, bold, 12) COLOURED(lr, lg, lb, 230)
               ENDIF
            ENDIF
         ELSE
            IF lu = 0 THEN
               IF lfs = 8 THEN
                  DRAWTEXT("↓ #thrTxt#%   50%: #dMed#m   Prob: #dnProb#%", lblX, ly, sansserif, bold, 8) COLOURED(lr, lg, lb, 230)
               ELSIF lfs = 10 THEN
                  DRAWTEXT("↓ #thrTxt#%   50%: #dMed#m   Prob: #dnProb#%", lblX, ly, sansserif, bold, 10) COLOURED(lr, lg, lb, 230)
               ELSIF lfs = 14 THEN
                  DRAWTEXT("↓ #thrTxt#%   50%: #dMed#m   Prob: #dnProb#%", lblX, ly, sansserif, bold, 14) COLOURED(lr, lg, lb, 230)
               ELSIF lfs = 18 THEN
                  DRAWTEXT("↓ #thrTxt#%   50%: #dMed#m   Prob: #dnProb#%", lblX, ly, sansserif, bold, 18) COLOURED(lr, lg, lb, 230)
               ELSE
                  DRAWTEXT("↓ #thrTxt#%   50%: #dMed#m   Prob: #dnProb#%", lblX, ly, sansserif, bold, 12) COLOURED(lr, lg, lb, 230)
               ENDIF
            ELSIF lu = 1 THEN
               IF lfs = 8 THEN
                  DRAWTEXT("↓ #thrTxt#%   50%: #dMed#h   Prob: #dnProb#%", lblX, ly, sansserif, bold, 8) COLOURED(lr, lg, lb, 230)
               ELSIF lfs = 10 THEN
                  DRAWTEXT("↓ #thrTxt#%   50%: #dMed#h   Prob: #dnProb#%", lblX, ly, sansserif, bold, 10) COLOURED(lr, lg, lb, 230)
               ELSIF lfs = 14 THEN
                  DRAWTEXT("↓ #thrTxt#%   50%: #dMed#h   Prob: #dnProb#%", lblX, ly, sansserif, bold, 14) COLOURED(lr, lg, lb, 230)
               ELSIF lfs = 18 THEN
                  DRAWTEXT("↓ #thrTxt#%   50%: #dMed#h   Prob: #dnProb#%", lblX, ly, sansserif, bold, 18) COLOURED(lr, lg, lb, 230)
               ELSE
                  DRAWTEXT("↓ #thrTxt#%   50%: #dMed#h   Prob: #dnProb#%", lblX, ly, sansserif, bold, 12) COLOURED(lr, lg, lb, 230)
               ENDIF
            ELSIF lu = 2 THEN
               IF lfs = 8 THEN
                  DRAWTEXT("↓ #thrTxt#%   50%: #dMed#d   Prob: #dnProb#%", lblX, ly, sansserif, bold, 8) COLOURED(lr, lg, lb, 230)
               ELSIF lfs = 10 THEN
                  DRAWTEXT("↓ #thrTxt#%   50%: #dMed#d   Prob: #dnProb#%", lblX, ly, sansserif, bold, 10) COLOURED(lr, lg, lb, 230)
               ELSIF lfs = 14 THEN
                  DRAWTEXT("↓ #thrTxt#%   50%: #dMed#d   Prob: #dnProb#%", lblX, ly, sansserif, bold, 14) COLOURED(lr, lg, lb, 230)
               ELSIF lfs = 18 THEN
                  DRAWTEXT("↓ #thrTxt#%   50%: #dMed#d   Prob: #dnProb#%", lblX, ly, sansserif, bold, 18) COLOURED(lr, lg, lb, 230)
               ELSE
                  DRAWTEXT("↓ #thrTxt#%   50%: #dMed#d   Prob: #dnProb#%", lblX, ly, sansserif, bold, 12) COLOURED(lr, lg, lb, 230)
               ENDIF
            ELSE
               IF lfs = 8 THEN
                  DRAWTEXT("↓ #thrTxt#%   50%: N/A   Prob: #dnProb#%", lblX, ly, sansserif, bold, 8) COLOURED(lr, lg, lb, 230)
               ELSIF lfs = 10 THEN
                  DRAWTEXT("↓ #thrTxt#%   50%: N/A   Prob: #dnProb#%", lblX, ly, sansserif, bold, 10) COLOURED(lr, lg, lb, 230)
               ELSIF lfs = 14 THEN
                  DRAWTEXT("↓ #thrTxt#%   50%: N/A   Prob: #dnProb#%", lblX, ly, sansserif, bold, 14) COLOURED(lr, lg, lb, 230)
               ELSIF lfs = 18 THEN
                  DRAWTEXT("↓ #thrTxt#%   50%: N/A   Prob: #dnProb#%", lblX, ly, sansserif, bold, 18) COLOURED(lr, lg, lb, 230)
               ELSE
                  DRAWTEXT("↓ #thrTxt#%   50%: N/A   Prob: #dnProb#%", lblX, ly, sansserif, bold, 12) COLOURED(lr, lg, lb, 230)
               ENDIF
            ENDIF
         ENDIF
      NEXT
   ENDIF

   //----------------------------------------------
   // === RESULTS TABLE (anchored to the window, top-right) ===
   // Columns: level | upside | downside. Row height 20 px.
   // Rows are contiguous, as in the original (its unused row numbers take no space).
   //----------------------------------------------
   c2R = dashX
   c2L = dashX - 100
   c1R = c2L
   c1L = c1R - 100
   c0R = c1L
   c0L = c0R - 130
   c0X = (c0L + c0R) / 2
   c1X = (c1L + c1R) / 2
   c2X = (c2L + c2R) / 2

   // header
   hy = dashY
   DRAWRECTANGLE(c0L, hy + 10, c0R, hy - 10) ANCHOR(TOPRIGHT, XSHIFT, YSHIFT) COLOURED(255, 255, 255, 255) FILLCOLOR(33, 150, 243, 255)
   DRAWRECTANGLE(c1L, hy + 10, c1R, hy - 10) ANCHOR(TOPRIGHT, XSHIFT, YSHIFT) COLOURED(255, 255, 255, 255) FILLCOLOR(76, 175, 80, 255)
   DRAWRECTANGLE(c2L, hy + 10, c2R, hy - 10) ANCHOR(TOPRIGHT, XSHIFT, YSHIFT) COLOURED(255, 255, 255, 255) FILLCOLOR(242, 54, 69, 255)
   IF distType = 0 THEN
      DRAWTEXT("Percentile", c0X, hy, sansserif, bold, 10) COLOURED(255, 255, 255, 255) ANCHOR(TOPRIGHT, XSHIFT, YSHIFT)
   ELSE
      DRAWTEXT("Std Dev", c0X, hy, sansserif, bold, 10) COLOURED(255, 255, 255, 255) ANCHOR(TOPRIGHT, XSHIFT, YSHIFT)
   ENDIF
   thrHd = round(thresholdPct * 10) / 10
   DRAWTEXT("Upside +#thrHd#%", c1X, hy, sansserif, bold, 10) COLOURED(255, 255, 255, 255) ANCHOR(TOPRIGHT, XSHIFT, YSHIFT)
   DRAWTEXT("Downside -#thrHd#%", c2X, hy, sansserif, bold, 10) COLOURED(255, 255, 255, 255) ANCHOR(TOPRIGHT, XSHIFT, YSHIFT)

   // percentile / sigma rows
   FOR k = 0 TO nRows - 1 DO
      ry = dashY - 20 * (k + 1)
      IF (k MOD 2) = 0 THEN
         ga = 102
      ELSE
         ga = 64
      ENDIF
      DRAWRECTANGLE(c0L, ry + 10, c0R, ry - 10) ANCHOR(TOPRIGHT, XSHIFT, YSHIFT) COLOURED(255, 255, 255, 255) FILLCOLOR(120, 123, 134, ga)
      DRAWRECTANGLE(c1L, ry + 10, c1R, ry - 10) ANCHOR(TOPRIGHT, XSHIFT, YSHIFT) COLOURED(255, 255, 255, 255) FILLCOLOR(76, 175, 80, 102)
      DRAWRECTANGLE(c2L, ry + 10, c2R, ry - 10) ANCHOR(TOPRIGHT, XSHIFT, YSHIFT) COLOURED(255, 255, 255, 255) FILLCOLOR(242, 54, 69, 102)
      rowPct = $pctL[k]
      IF distType = 0 THEN
         DRAWTEXT("#rowPct#%", c0X, ry, sansserif, standard, 10) COLOURED(0, 0, 0, 255) ANCHOR(TOPRIGHT, XSHIFT, YSHIFT)
      ELSIF k = 0 THEN
         DRAWTEXT("2σ (2.28%)", c0X, ry, sansserif, standard, 10) COLOURED(0, 0, 0, 255) ANCHOR(TOPRIGHT, XSHIFT, YSHIFT)
      ELSE
         DRAWTEXT("1σ (15.87%)", c0X, ry, sansserif, standard, 10) COLOURED(0, 0, 0, 255) ANCHOR(TOPRIGHT, XSHIFT, YSHIFT)
      ENDIF
   NEXT

   // sigma mode: theoretical minimum row
   IF distType = 1 THEN
      nTime = 2 * nRows + 2
   ELSE
      nTime = 2 * nRows
   ENDIF
   IF distType = 1 THEN
      ry = dashY - 20 * (nRows + 1)
      DRAWRECTANGLE(c0L, ry + 10, c0R, ry - 10) ANCHOR(TOPRIGHT, XSHIFT, YSHIFT) COLOURED(255, 255, 255, 255) FILLCOLOR(156, 39, 176, 255)
      DRAWRECTANGLE(c1L, ry + 10, c1R, ry - 10) ANCHOR(TOPRIGHT, XSHIFT, YSHIFT) COLOURED(255, 255, 255, 255) FILLCOLOR(156, 39, 176, 102)
      DRAWRECTANGLE(c2L, ry + 10, c2R, ry - 10) ANCHOR(TOPRIGHT, XSHIFT, YSHIFT) COLOURED(255, 255, 255, 255) FILLCOLOR(156, 39, 176, 102)
      DRAWTEXT("Theoretical Min", c0X, ry, sansserif, standard, 9) COLOURED(255, 255, 255, 255) ANCHOR(TOPRIGHT, XSHIFT, YSHIFT)
   ENDIF

   // time cells: slot, column centre, row centre, "~" prefix
   FOR j = 0 TO nTime - 1 DO
      IF j < nRows THEN
         slot = j
         cx = c1X
         cy = dashY - 20 * (j + 1)
         pre = 0
      ELSIF j < 2 * nRows THEN
         slot = 5 + j - nRows
         cx = c2X
         cy = dashY - 20 * (j - nRows + 1)
         pre = 0
      ELSIF j = 2 * nRows THEN
         slot = 12
         cx = c1X
         cy = dashY - 20 * (nRows + 1)
         pre = 1
      ELSE
         slot = 13
         cx = c2X
         cy = dashY - 20 * (nRows + 1)
         pre = 1
      ENDIF
      tv = $fN[slot]
      tu = $fU[slot]
      IF pre = 0 THEN
         IF tu = 0 THEN
            DRAWTEXT("#tv#m", cx, cy, sansserif, standard, 10) COLOURED(0, 0, 0, 255) ANCHOR(TOPRIGHT, XSHIFT, YSHIFT)
         ELSIF tu = 1 THEN
            DRAWTEXT("#tv#h", cx, cy, sansserif, standard, 10) COLOURED(0, 0, 0, 255) ANCHOR(TOPRIGHT, XSHIFT, YSHIFT)
         ELSIF tu = 2 THEN
            DRAWTEXT("#tv#d", cx, cy, sansserif, standard, 10) COLOURED(0, 0, 0, 255) ANCHOR(TOPRIGHT, XSHIFT, YSHIFT)
         ELSE
            DRAWTEXT("N/A", cx, cy, sansserif, standard, 10) COLOURED(0, 0, 0, 255) ANCHOR(TOPRIGHT, XSHIFT, YSHIFT)
         ENDIF
      ELSE
         IF tu = 0 THEN
            DRAWTEXT("~#tv#m", cx, cy, sansserif, standard, 9) COLOURED(0, 0, 0, 255) ANCHOR(TOPRIGHT, XSHIFT, YSHIFT)
         ELSIF tu = 1 THEN
            DRAWTEXT("~#tv#h", cx, cy, sansserif, standard, 9) COLOURED(0, 0, 0, 255) ANCHOR(TOPRIGHT, XSHIFT, YSHIFT)
         ELSE
            DRAWTEXT("~#tv#d", cx, cy, sansserif, standard, 9) COLOURED(0, 0, 0, 255) ANCHOR(TOPRIGHT, XSHIFT, YSHIFT)
         ENDIF
      ENDIF
   NEXT

   // first hit rate
   IF distType = 1 THEN
      rowN = nRows + 2
   ELSE
      rowN = nRows + 1
   ENDIF
   ry = dashY - 20 * rowN
   upRt = round(upRate * 10) / 10
   dnRt = round(dnRate * 10) / 10
   DRAWRECTANGLE(c0L, ry + 10, c0R, ry - 10) ANCHOR(TOPRIGHT, XSHIFT, YSHIFT) COLOURED(255, 255, 255, 255) FILLCOLOR(255, 152, 0, 255)
   DRAWRECTANGLE(c1L, ry + 10, c1R, ry - 10) ANCHOR(TOPRIGHT, XSHIFT, YSHIFT) COLOURED(255, 255, 255, 255) FILLCOLOR(76, 175, 80, 102)
   DRAWRECTANGLE(c2L, ry + 10, c2R, ry - 10) ANCHOR(TOPRIGHT, XSHIFT, YSHIFT) COLOURED(255, 255, 255, 255) FILLCOLOR(242, 54, 69, 102)
   DRAWTEXT("First Hit (#upFirst# ↑ #dnFirst# ↓)", c0X, ry, sansserif, standard, 9) COLOURED(255, 255, 255, 255) ANCHOR(TOPRIGHT, XSHIFT, YSHIFT)
   DRAWTEXT("#upRt#%", c1X, ry, sansserif, standard, 10) COLOURED(0, 0, 0, 255) ANCHOR(TOPRIGHT, XSHIFT, YSHIFT)
   DRAWTEXT("#dnRt#%", c2X, ry, sansserif, standard, 10) COLOURED(0, 0, 0, 255) ANCHOR(TOPRIGHT, XSHIFT, YSHIFT)

   // warning when many paths never reach a barrier
   IF totalFirst < numSims * 0.9 THEN
      rowN = rowN + 1
      ry = dashY - 20 * rowN
      DRAWRECTANGLE(c0L, ry + 10, c0R, ry - 10) ANCHOR(TOPRIGHT, XSHIFT, YSHIFT) COLOURED(255, 255, 255, 255) FILLCOLOR(255, 152, 0, 255)
      DRAWRECTANGLE(c1L, ry + 10, c1R, ry - 10) ANCHOR(TOPRIGHT, XSHIFT, YSHIFT) COLOURED(255, 255, 255, 255) FILLCOLOR(255, 152, 0, 102)
      DRAWRECTANGLE(c2L, ry + 10, c2R, ry - 10) ANCHOR(TOPRIGHT, XSHIFT, YSHIFT) COLOURED(255, 255, 255, 255) FILLCOLOR(255, 152, 0, 102)
      DRAWTEXT("⚠ Low Hit Rate", c0X, ry, sansserif, standard, 9) COLOURED(255, 255, 255, 255) ANCHOR(TOPRIGHT, XSHIFT, YSHIFT)
      DRAWTEXT("Increase Max", c1X, ry, sansserif, standard, 9) COLOURED(0, 0, 0, 255) ANCHOR(TOPRIGHT, XSHIFT, YSHIFT)
      DRAWTEXT("Periods!", c2X, ry, sansserif, standard, 9) COLOURED(0, 0, 0, 255) ANCHOR(TOPRIGHT, XSHIFT, YSHIFT)
   ENDIF

   // average time when hit
   rowN = rowN + 1
   ry = dashY - 20 * rowN
   DRAWRECTANGLE(c0L, ry + 10, c0R, ry - 10) ANCHOR(TOPRIGHT, XSHIFT, YSHIFT) COLOURED(255, 255, 255, 255) FILLCOLOR(255, 152, 0, 255)
   DRAWRECTANGLE(c1L, ry + 10, c1R, ry - 10) ANCHOR(TOPRIGHT, XSHIFT, YSHIFT) COLOURED(255, 255, 255, 255) FILLCOLOR(76, 175, 80, 102)
   DRAWRECTANGLE(c2L, ry + 10, c2R, ry - 10) ANCHOR(TOPRIGHT, XSHIFT, YSHIFT) COLOURED(255, 255, 255, 255) FILLCOLOR(242, 54, 69, 102)
   DRAWTEXT("Avg Time (if hit)", c0X, ry, sansserif, standard, 9) COLOURED(255, 255, 255, 255) ANCHOR(TOPRIGHT, XSHIFT, YSHIFT)
   FOR j = 0 TO 1 DO
      IF j = 0 THEN
         tv = $fN[14]
         tu = $fU[14]
         cx = c1X
      ELSE
         tv = $fN[15]
         tu = $fU[15]
         cx = c2X
      ENDIF
      IF tu = 0 THEN
         DRAWTEXT("#tv#m", cx, ry, sansserif, standard, 10) COLOURED(0, 0, 0, 255) ANCHOR(TOPRIGHT, XSHIFT, YSHIFT)
      ELSIF tu = 1 THEN
         DRAWTEXT("#tv#h", cx, ry, sansserif, standard, 10) COLOURED(0, 0, 0, 255) ANCHOR(TOPRIGHT, XSHIFT, YSHIFT)
      ELSIF tu = 2 THEN
         DRAWTEXT("#tv#d", cx, ry, sansserif, standard, 10) COLOURED(0, 0, 0, 255) ANCHOR(TOPRIGHT, XSHIFT, YSHIFT)
      ELSE
         DRAWTEXT("N/A", cx, ry, sansserif, standard, 10) COLOURED(0, 0, 0, 255) ANCHOR(TOPRIGHT, XSHIFT, YSHIFT)
      ENDIF
   NEXT

   // directional bias
   rowN = rowN + 1
   ry = dashY - 20 * rowN
   biasStr = round(abs(upRate - dnRate) * 10) / 10
   IF upRate > dnRate THEN
      bR = 76
      bG = 175
      bB = 80
   ELSIF dnRate > upRate THEN
      bR = 242
      bG = 54
      bB = 69
   ELSE
      bR = 120
      bG = 123
      bB = 134
   ENDIF
   DRAWRECTANGLE(c0L, ry + 10, c0R, ry - 10) ANCHOR(TOPRIGHT, XSHIFT, YSHIFT) COLOURED(255, 255, 255, 255) FILLCOLOR(255, 152, 0, 255)
   DRAWRECTANGLE(c1L, ry + 10, c1R, ry - 10) ANCHOR(TOPRIGHT, XSHIFT, YSHIFT) COLOURED(255, 255, 255, 255) FILLCOLOR(bR, bG, bB, 102)
   DRAWRECTANGLE(c2L, ry + 10, c2R, ry - 10) ANCHOR(TOPRIGHT, XSHIFT, YSHIFT) COLOURED(255, 255, 255, 255) FILLCOLOR(120, 123, 134, 102)
   DRAWTEXT("Directional Bias", c0X, ry, sansserif, standard, 10) COLOURED(255, 255, 255, 255) ANCHOR(TOPRIGHT, XSHIFT, YSHIFT)
   IF upRate > dnRate THEN
      DRAWTEXT("Bullish ↑", c1X, ry, sansserif, bold, 10) COLOURED(0, 0, 0, 255) ANCHOR(TOPRIGHT, XSHIFT, YSHIFT)
   ELSIF dnRate > upRate THEN
      DRAWTEXT("Bearish ↓", c1X, ry, sansserif, bold, 10) COLOURED(0, 0, 0, 255) ANCHOR(TOPRIGHT, XSHIFT, YSHIFT)
   ELSE
      DRAWTEXT("Neutral ↔", c1X, ry, sansserif, bold, 10) COLOURED(0, 0, 0, 255) ANCHOR(TOPRIGHT, XSHIFT, YSHIFT)
   ENDIF
   DRAWTEXT("#biasStr#%", c2X, ry, sansserif, standard, 10) COLOURED(0, 0, 0, 255) ANCHOR(TOPRIGHT, XSHIFT, YSHIFT)

   // diagnostics: annualised drift (scaled by the square root of the periods per year) and drift mode
   periodsYear = 525600 / tfMin
   IF showDiag = 1 THEN
      rowN = rowN + 1
      ry = dashY - 20 * rowN
      annDrift = round(driftRaw * sqrt(periodsYear) * 100 * 100) / 100
      DRAWRECTANGLE(c0L, ry + 10, c0R, ry - 10) ANCHOR(TOPRIGHT, XSHIFT, YSHIFT) COLOURED(255, 255, 255, 255) FILLCOLOR(156, 39, 176, 255)
      DRAWRECTANGLE(c1L, ry + 10, c2R, ry - 10) ANCHOR(TOPRIGHT, XSHIFT, YSHIFT) COLOURED(255, 255, 255, 255) FILLCOLOR(156, 39, 176, 102)
      DRAWTEXT("Ann. Drift", c0X, ry, sansserif, standard, 9) COLOURED(255, 255, 255, 255) ANCHOR(TOPRIGHT, XSHIFT, YSHIFT)
      DRAWTEXT("#annDrift#%", c1X, ry, sansserif, standard, 9) COLOURED(0, 0, 0, 255) ANCHOR(TOPRIGHT, XSHIFT, YSHIFT)
      rowN = rowN + 1
      ry = dashY - 20 * rowN
      DRAWRECTANGLE(c0L, ry + 10, c0R, ry - 10) ANCHOR(TOPRIGHT, XSHIFT, YSHIFT) COLOURED(255, 255, 255, 255) FILLCOLOR(156, 39, 176, 255)
      DRAWRECTANGLE(c1L, ry + 10, c2R, ry - 10) ANCHOR(TOPRIGHT, XSHIFT, YSHIFT) COLOURED(255, 255, 255, 255) FILLCOLOR(156, 39, 176, 102)
      DRAWTEXT("Drift Mode", c0X, ry, sansserif, standard, 9) COLOURED(255, 255, 255, 255) ANCHOR(TOPRIGHT, XSHIFT, YSHIFT)
      IF driftMode = 1 THEN
         DRAWTEXT("Zero (Neutral)", c1X, ry, sansserif, standard, 9) COLOURED(0, 0, 0, 255) ANCHOR(TOPRIGHT, XSHIFT, YSHIFT)
      ELSIF driftMode = 2 THEN
         DRAWTEXT("50% Reduced", c1X, ry, sansserif, standard, 9) COLOURED(0, 0, 0, 255) ANCHOR(TOPRIGHT, XSHIFT, YSHIFT)
      ELSE
         DRAWTEXT("Historical", c1X, ry, sansserif, standard, 9) COLOURED(0, 0, 0, 255) ANCHOR(TOPRIGHT, XSHIFT, YSHIFT)
      ENDIF
   ENDIF

   // annualised volatility
   rowN = rowN + 1
   ry = dashY - 20 * rowN
   annVol = round(volat * sqrt(periodsYear) * 100 * 100) / 100
   DRAWRECTANGLE(c0L, ry + 10, c0R, ry - 10) ANCHOR(TOPRIGHT, XSHIFT, YSHIFT) COLOURED(255, 255, 255, 255) FILLCOLOR(255, 152, 0, 255)
   DRAWRECTANGLE(c1L, ry + 10, c2R, ry - 10) ANCHOR(TOPRIGHT, XSHIFT, YSHIFT) COLOURED(255, 255, 255, 255) FILLCOLOR(120, 123, 134, 102)
   DRAWTEXT("Ann. Volatility", c0X, ry, sansserif, standard, 10) COLOURED(255, 255, 255, 255) ANCHOR(TOPRIGHT, XSHIFT, YSHIFT)
   DRAWTEXT("#annVol#%", c1X, ry, sansserif, standard, 10) COLOURED(0, 0, 0, 255) ANCHOR(TOPRIGHT, XSHIFT, YSHIFT)
ENDIF

RETURN
Conclusion
First Passage Time turns volatility into something a trader can plan with: a waiting time and a probability. It does not predict direction, but it makes the cost of time visible, which is often the missing piece when choosing between a tight and a wide target. Use it as a sanity check before setting targets, stops or expiries, and remember that its numbers inherit the assumptions of the random walk behind them.