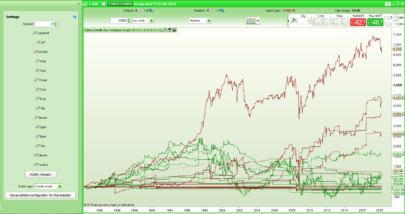
Same Candle Run Analysis Graph
Same Candle Run Analysis Graph returns in graphical format the won/lost total amount results of my Same Candle Run Analysis Tool. The graphical format allows you to more easily see how consistent over time the results have been. It can be … Continue reading Same Candle Run Analysis Graph
Copy and paste this URL into your WordPress site to embed
Copy and paste this code into your site to embed