




More from ProRealCode
ProRealCode - Trading & Coding with ProRealTime™
The ProRealTime™ community on the web! Officially sharing ProRealTime knowledge to Worldwide users since 2015!



BYP Supports Resistances Ex
May 18, 2026, 3:30 PM
Indicators
0 Comments
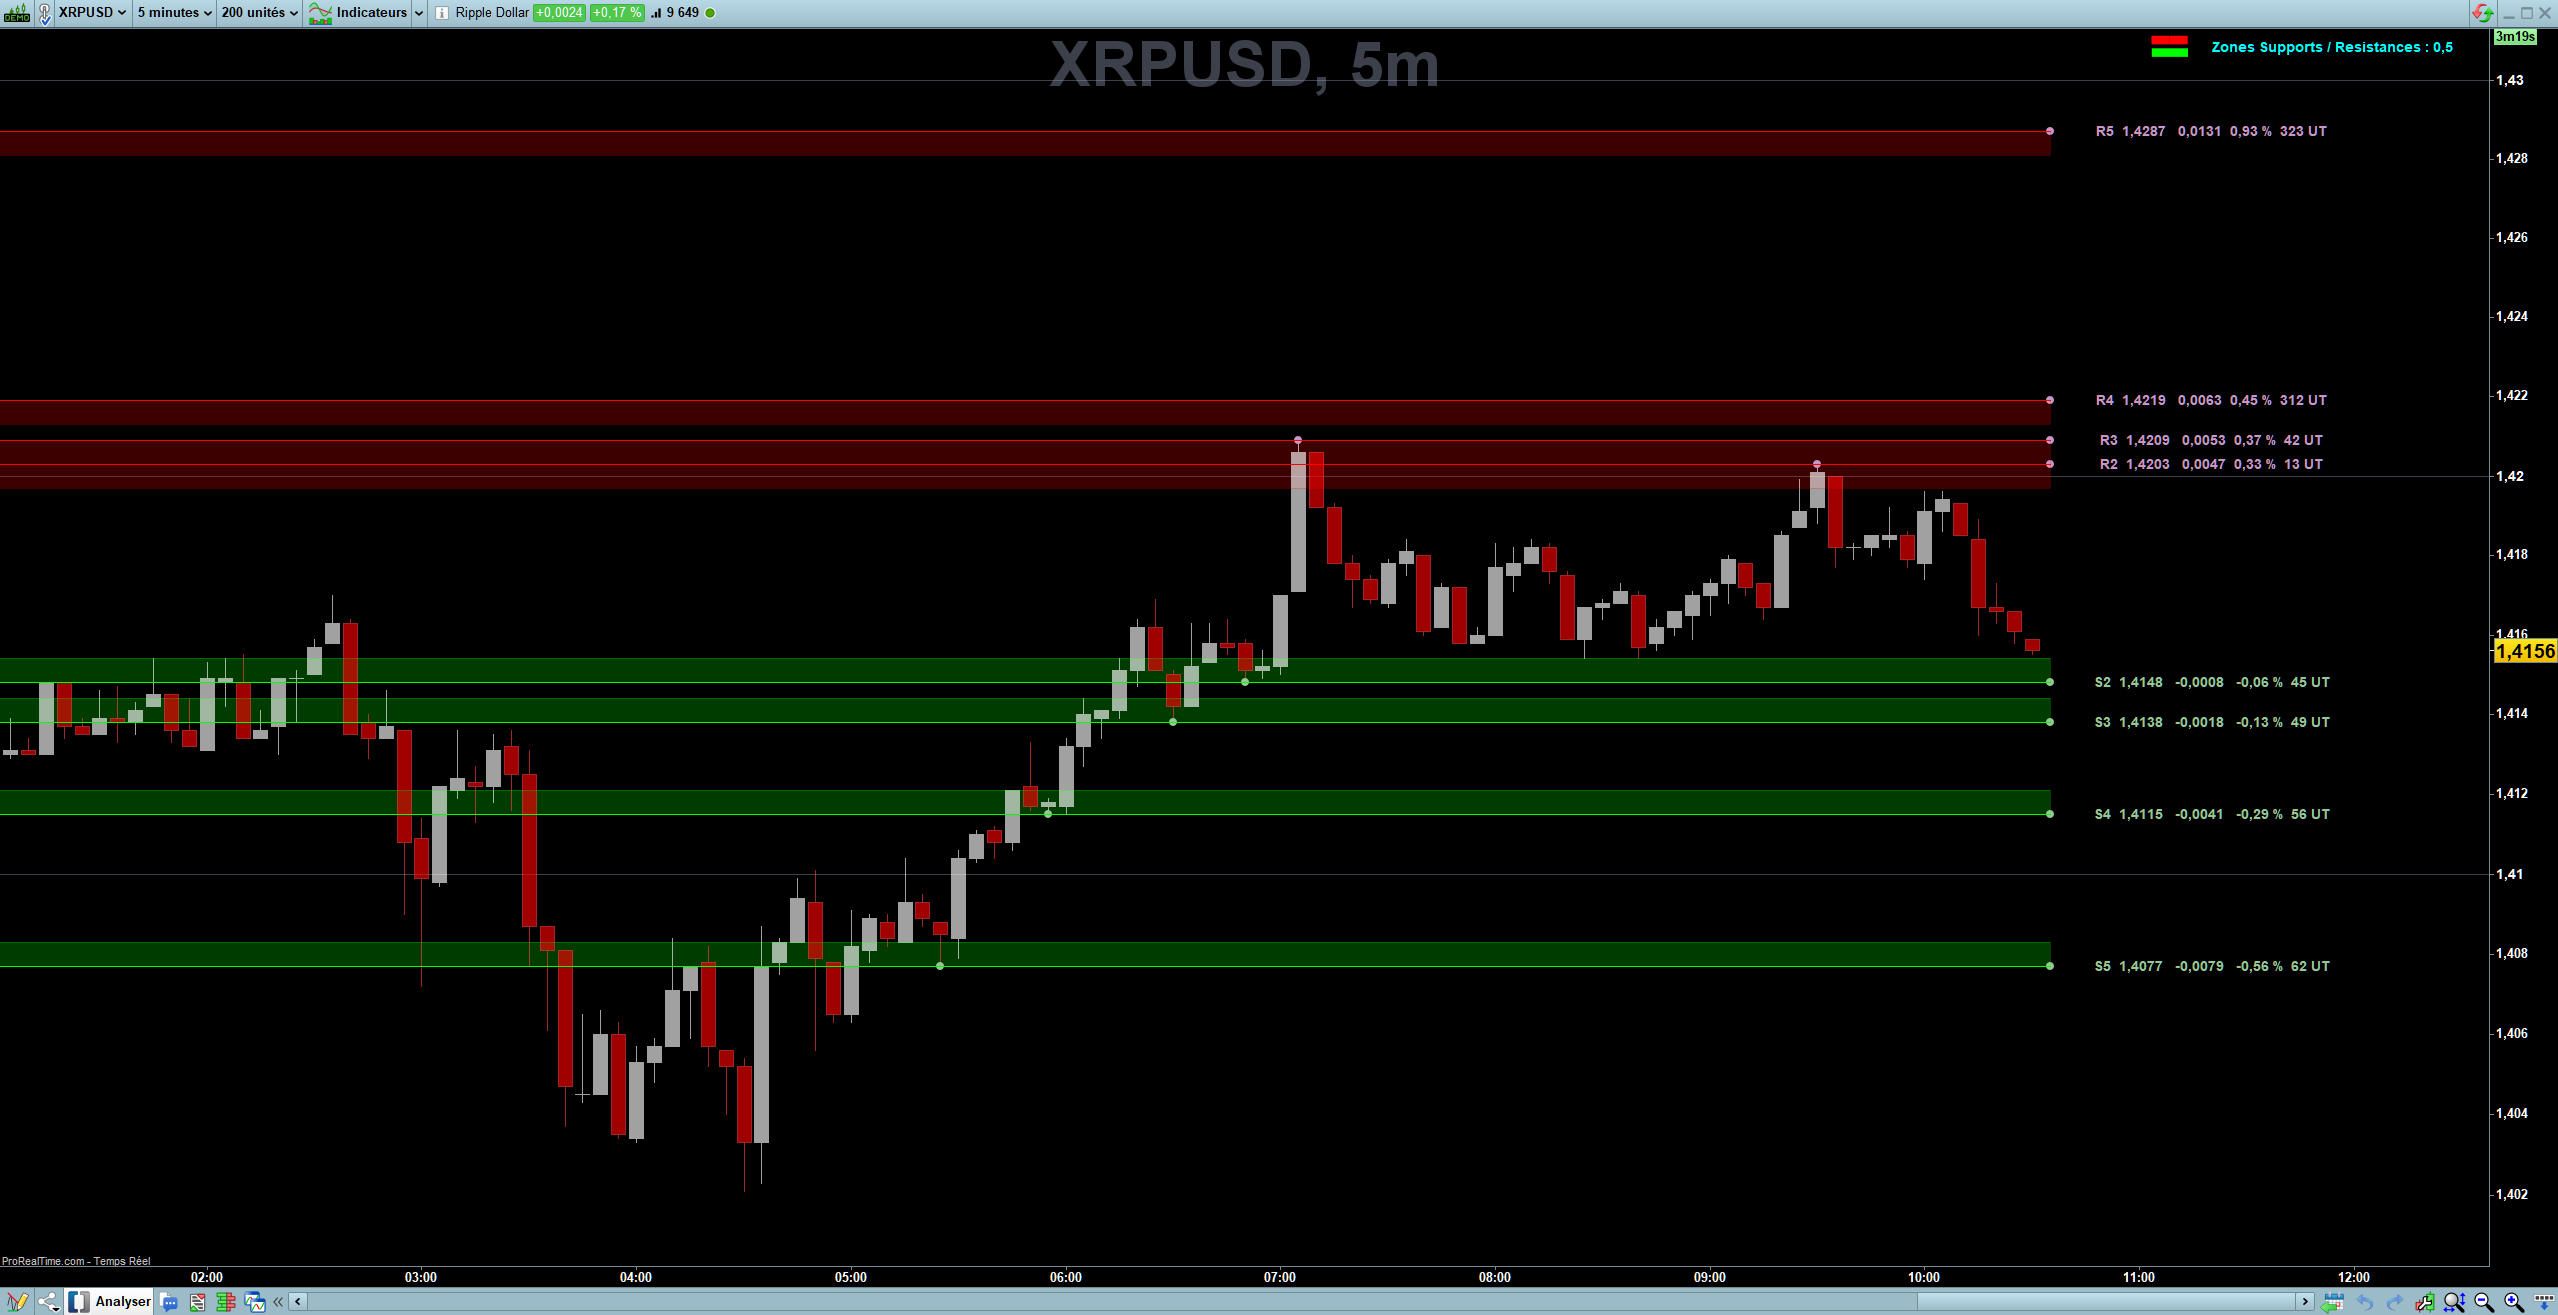
This indicator automatically detects and draws support and resistance zones on your chart using a combination of swing-high/swing-low logic and an ATR-based zone width — no manual drawing required.
Added an extension option for the “BYP Supports Resistances” algorithm published on October 1, 2025.
This allows for a quick look at historical price data.
The script scans past bars to find meaningful price pivots, then draws coloured rectangles (zones) and horizontal lines from each pivot to the right edge of the chart. Resistance zones appear in red, support zones in green. A small label optionally shows the price, distance from close, and how many bars ago the level formed.
//======================================================================================================================
// ProRealTime V12 / Partage des connaissances ProRealTime. / Sharing ProRealTime knowledge.
// 2026 05 16 19:21 / 2025 09 26 18:25 / 2025 08 16 00:13
// by Bernard13 "BYP"

//======================================================================================================================
// #I BYP Supports Résistances
//======================================================================================================================
DEFPARAM DrawOnlastBarOnly= True // Force the graph to the right
//DEFPARAM CalculateOnLastBars= 10000

X= BarIndex
k= 2 // Number of decimal
ATR= AverageTrueRange[13](Close)

// Segments, points, rectangles.
Margin= 1
IF Extensions THEN // No extension by default

Xmax=0
IF IsLastBarUpdate THEN
ext= 0
ENDIF
ELSE
ext= 1
ENDIF

//===================================================================================================================
// SUPPORTS RESISTANCES LINKED
//===================================================================================================================
IF NumRS > 0 THEN //----- Linked S/R pairs (S1/R1, S2/R2, S3/R3, ...)
StartR= NumRS
StartS= NumRS
ELSE // Free (S2, R5, S6, R3, ...)
NumRS= 0
ENDIF

//===================================================================================================================
// RESISTANCES
//===================================================================================================================
IF Resistances THEN
goUp= High[1] >= High
i= 0

//----- Start Résistance
FOR r= 1 TO StartR DO // Search for the first selected resistance level
y= High[i]
WHILE High[i+1] <= y DO // Not below the highest point
i= i + 1
WEND
WHILE goUp[i] DO // Highest point above
i= i + 1
WEND
NEXT
StartR= r - 1 // First resistance level selected

//----- All Résistances
FOR NumR= StartR TO NumberR DO
y= High[i]
dy= y - nAtr * ATR //Zone * ATR * PipSize
var= y - Close
varpc= ROUND((var / Close * 100), k)
IF PipSize = 0.0001 THEN // In Pips, not in Points
var= (y - Close) / PipSize
ENDIF

//----- Display Résistance
DrawPoint(BarIndex[i], y, 2) Coloured(200,150,200)
DrawPoint(BarIndex+Margin, y, 2) Coloured(200,150,200)
DrawSegment(Xmax + ext * BarIndex[i], y, Barindex+Margin, y) Coloured(255,0,0)
DrawRectangle(Xmax + ext * BarIndex[i], y, BarIndex+Margin, dy) Coloured(255,0,0,a) BorderColor(255,0,0,a)
IF LevelsSR THEN // Optional information
i= i + 1
DrawText("R#NumR# #y# #var# #varpc#% #i#UT", BarIndex+xAdjust, y, Dialog, Bold, 14) Coloured(200,150,200)
ENDIF

//----- Next Résistance
WHILE High[i] <= y DO // Not below the highest pont
i= i + 1
WEND
WHILE goUp[i] DO // Highest point above
i= i + 1
WEND
NEXT //... NumR

ENDIF //... Resistances

//===================================================================================================================
// SUPPORTS
//===================================================================================================================
IF Supports THEN
goDown= Low[1] <= Low
i= 0

//----- Start Support
FOR s= 1 TO StartS DO // Search for the first selected support level
y= Low[i]
WHILE Low[i+1] >= y DO // Not above the lowest point
i= i + 1
WEND
WHILE goDown[i] DO // Lowest point below
i= i + 1
WEND
NEXT
StartS= s - 1

//----- All Supports
FOR NumS= StartS TO NumberS DO
y= Low[i]
dy= y + nAtr * ATR //Zone * ATR * PipSize
var= y - Close
varpc= ROUND((var / Close * 100), k)
IF PipSize = 0.0001 THEN // In Pips, not in Points
var= (y - Close) / PipSize
ENDIF

//----- Display Support
DrawPoint(BarIndex[i], y, 2) Coloured(150,200,150)
DrawPoint(BarIndex+Margin, y, 2) Coloured(150,200,150)
DrawSegment(Xmax + ext * BarIndex[i], y, Barindex+Margin, y) Coloured(0,255,0)
DrawRectangle(Xmax + ext * BarIndex[i], y, BarIndex+Margin, dy) Coloured(0,255,0,a) BorderColor(0,255,0,a)
IF LevelsSR THEN // Optional information
i= i + 1
DrawText("S#NumS# #y# #var# #varpc#% #i#UT", BarIndex+xAdjust, y, Dialog, Bold, 14) Coloured(150,200,150)
ENDIF

//----- Next Support
WHILE Low[i] >= y DO // Not above the lowest point
i= i + 1
WEND
WHILE goDown[i] DO // Lowest point below
i= i + 1
WEND
NEXT //---NumS

ENDIF //---Supports

//======================================================================================================================
// POINTS / PIPS
DrawText("▀▀", -320, -16, Dialog, Bold, 18) Coloured("Red") Anchor(TopRight)
DrawText("▄▄", -320, -20, Dialog, Bold, 18) Coloured("Lime") Anchor(TopRight)
DrawText("Zones Supports / Resistances : #nATR# ATR", -155, -20, Dialog, Bold, 14) Coloured("Aqua") Anchor(TopRight)

//======================================================================================================================
RETURN
//======================================================================================================================
Download
Filename:
BYP-Supports-Resistances-Ex.itf
Downloads:
40
Senior
Operating in the shadows, I hack problems one by one. My bio is currently encrypted by a complex algorithm. Decryption underway...
Author’s Profile
Similar code
BYP Supports ResistancesIndicators

RB-SR Dynamic supports resistancesIndicators
Loading...