







AutoTune Filter: John Ehlers' Band-Pass Filter
Introduction
A band-pass filter is one of the cleanest ways to isolate the cyclic part of a price series: it removes the trend and the high frequency noise and keeps only the swings around a chosen period. Its weakness is that you have to choose that period, and the dominant cycle of a market does not sit still. A filter tuned to 20 bars is lagging and distorted when the market is swinging every 12.
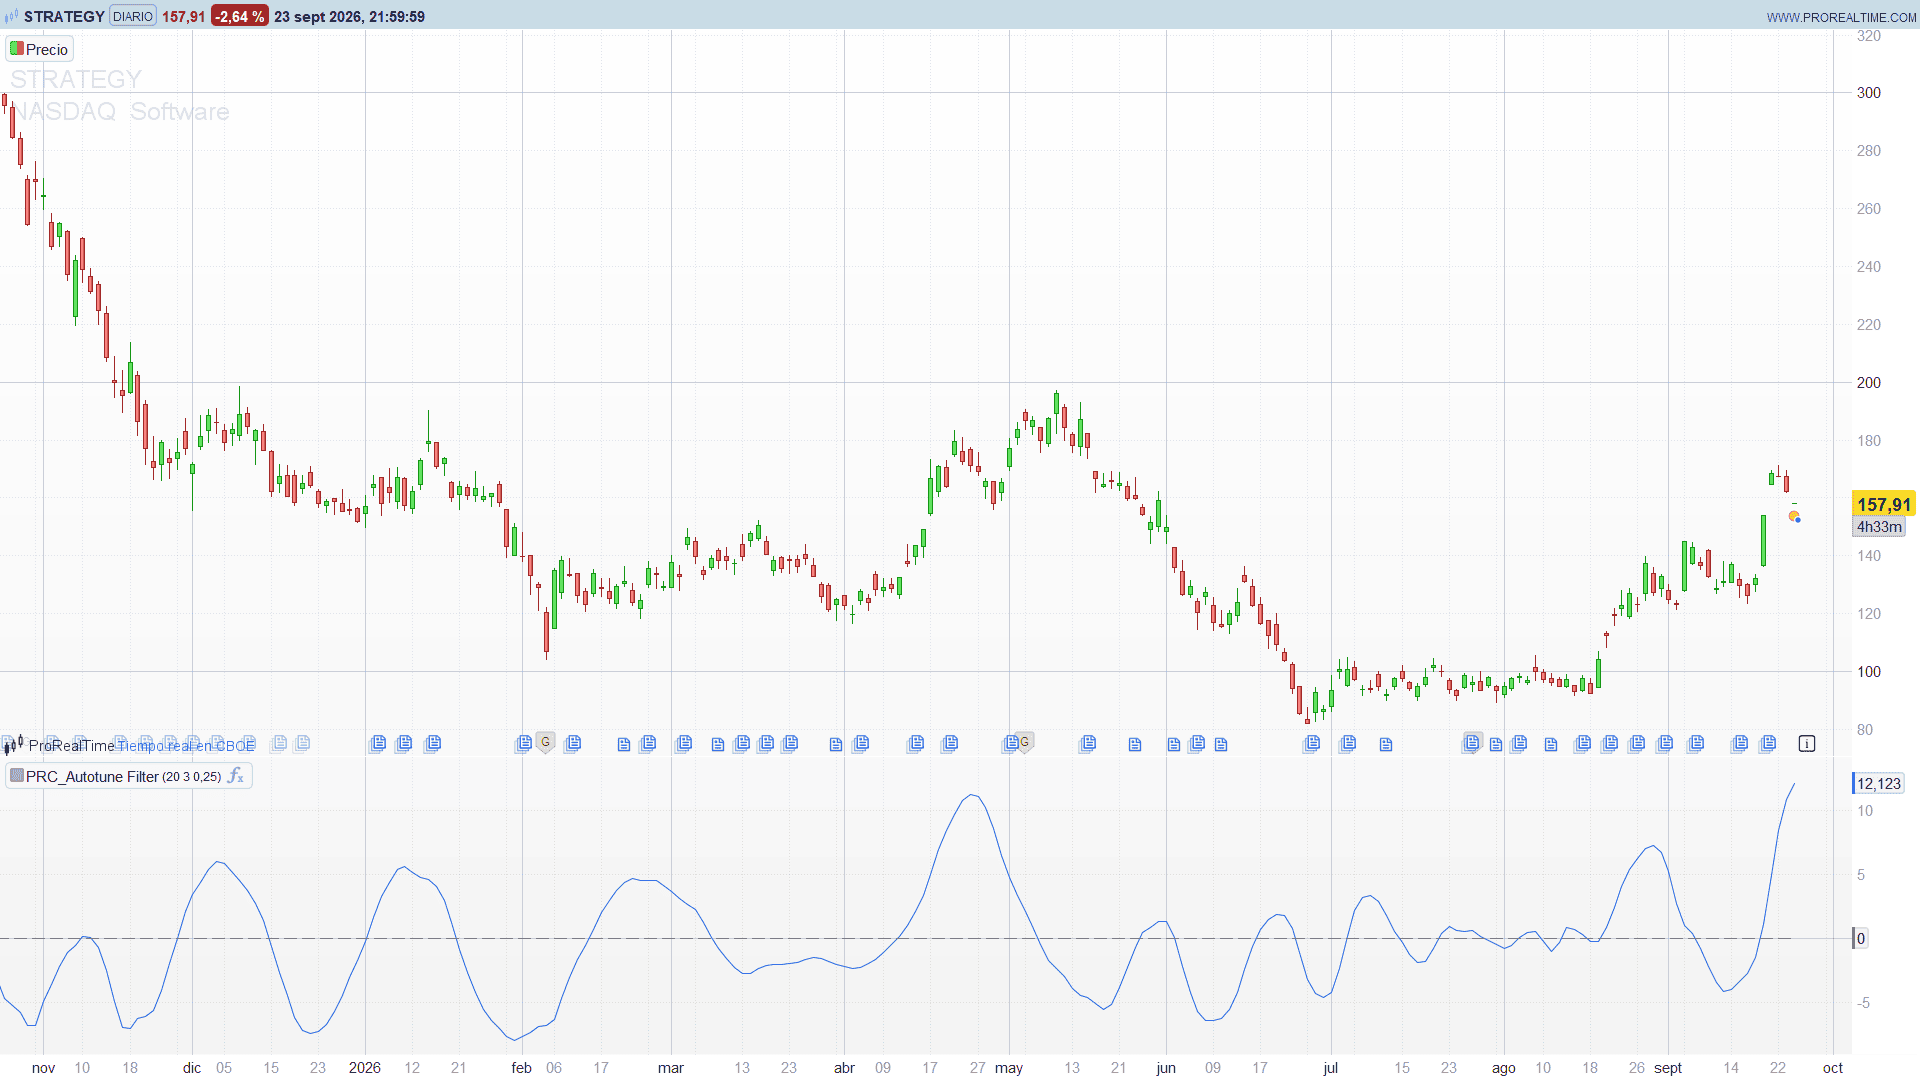
The AutoTune Filter, presented by John F. Ehlers in the May 2026 issue of Technical Analysis of Stocks & Commodities (“A Rolling Autocorrelation Function”), solves this by measuring the dominant cycle on every bar and re-centering the band-pass filter on it. The result is an oscillator that follows the rhythm the market is actually showing, not the one you guessed when you set the parameter.
Theory Behind the Indicator
1. Removing the trend
The price first goes through Ehlers’ two-pole high-pass filter with a cutoff equal to the window period. What survives is a zero-centred series made of the swings shorter than that period, with the trend removed.
2. A rolling autocorrelation
On that high-pass series the indicator computes the correlation between the last window bars and the same window shifted by 1, 2, 3… up to window bars. This is a rolling autocorrelation function, recalculated on every bar.
The key idea is simple: if the market is cycling with a period P, the series shifted by half a cycle (P/2 bars) is in phase opposition with itself, so the correlation at that lag is the most negative of all. Find the lag with the lowest correlation, double it, and you have the dominant cycle.
3. Limiting the jumps
The measured cycle is allowed to move by at most 2 bars per bar. This keeps the filter stable when the autocorrelation minimum jumps from one lag to another in noisy conditions.
4. The tuned band-pass filter
Finally, Ehlers’ band-pass filter is applied to the price with its centre period set to the dominant cycle of the current bar and a bandwidth of 0.25. This is the AutoTune Filter.
Key Features at a Glance
- Band-pass filter whose centre period adapts on every bar to the measured dominant cycle
- Dominant cycle measured with a rolling autocorrelation of the high-pass filtered price
- Four selectable outputs: high-pass filter, minimum correlation, dominant cycle and tuned band-pass filter
- A single main setting,
window, that controls both the high-pass cutoff and the range of cycles that can be detected (up to twice the window) - Works on any instrument and timeframe
How to Read the Indicator
- Tuned band-pass filter (default output). A smooth oscillator around zero. Its peaks and troughs mark the tops and bottoms of the current cycle; crossings of the zero line mark the midpoint of each swing.
- Dominant cycle. The period, in bars, the filter is tuned to. A stable value means the market is cycling regularly; a value that drifts steadily shows the rhythm is changing.
- Minimum correlation. How strong the cycle is. Values close to -1 mean a clean, well defined cycle; values near zero mean there is little cyclic structure and the filter output should be read with caution.
- High-pass filter. The detrended price the whole analysis is built on.
Practical Applications
- Timing entries inside a trend. Use the troughs of the band-pass filter to time pullback entries in an uptrend, and its peaks in a downtrend.
- Adaptive lookback for other tools. Read the dominant cycle output and use half of it as the period of an oscillator such as RSI or Stochastic, so that it follows the market rhythm.
- Filtering cycle signals. Only act on turns of the band-pass filter when the minimum correlation is clearly negative, which is when a real cycle is present.
Indicator Configuration
window(default: 20, minimum 3): high-pass filter period and length of the autocorrelation window. Cycles up to twice this value can be detected.dispType(default: 3): output to display. 0 = high-pass filter, 1 = minimum correlation, 2 = dominant cycle, 3 = tuned band-pass filter.bw(default: 0.25): bandwidth of the band-pass filter. Lower values give a narrower, smoother filter; higher values let more frequencies through.- Price source: selectable in the indicator settings (close by default).
Apply the indicator in its own panel below the price chart.
Code
//---------------------------------------------------------------
//PRC_AutoTune Filter
//version = 0
//24.09.2026
//Iván González @ www.prorealcode.com
//Author: John F. Ehlers
//Sharing ProRealTime knowledge
//--------------------------------------------------------------------//
// Apply it in its own panel (not on the price).

//----- Inputs
window = 20            // high-pass period and autocorrelation window (min 3)
dispType = 3           // 0 = high-pass filter, 1 = min. correlation, 2 = dominant cycle, 3 = tuned band-pass filter
bw = 0.25              // bandwidth of the band-pass filter
src = customclose

window = max(3, round(window))

//----- High-pass filter (ProBuilder trigonometry works in degrees)
wRad = 1.414 * 3.14159265 / window
qHp = exp(0 - wRad)
c1Hp = 2 * qHp * cos(1.414 * 180 / window)
c2Hp = qHp * qHp
a0Hp = 0.25 * (1 + c1Hp + c2Hp)
IF barindex >= 4 THEN
   hp = a0Hp * (src - 2 * src[1] + src[2]) + c1Hp * hp[1] - c2Hp * hp[2]
ELSE
   hp = 0
ENDIF

//----- Rolling autocorrelation of the high-pass series, lags 1..window
sx = summation[window](hp)
sxx = summation[window](hp * hp)

minCorr = 2
minLag = 1
FOR lagV = 1 TO window DO
   corr = 1
   IF barindex >= window - 1 + lagV THEN
      sy = sx[lagV]
      syy = sxx[lagV]
      sxy = 0
      FOR cV = 0 TO window - 1 DO
         sxy = sxy + hp[cV] * hp[cV + lagV]
      NEXT
      covV = window * sxy - sx * sy
      vx = window * sxx - sx * sx
      vy = window * syy - sy * sy
      den = vx * vy
      IF den > 0 THEN
         corr = covV / sqrt(den)
      ENDIF
   ENDIF
   // first lag with the lowest correlation
   IF corr < minCorr THEN
      minCorr = corr
      minLag = lagV
   ENDIF
NEXT

//----- Dominant cycle: twice the lag of lowest correlation, moving 2 bars at most per bar
dc = minLag * 2
IF barindex > 0 THEN
   dc = min(max(dc, dc[1] - 2), dc[1] + 2)
ENDIF

//----- Band-pass filter tuned to the dominant cycle
l1Bp = cos(360 / dc)
g1Bp = cos(360 * bw / dc)
s1Bp = 1 / g1Bp - sqrt(1 / (g1Bp * g1Bp) - 1)
IF barindex >= 3 THEN
   bp = 0.5 * (1 - s1Bp) * (src - src[2]) + l1Bp * (1 + s1Bp) * bp[1] - s1Bp * bp[2]
ELSE
   bp = 0
ENDIF

//----- Output
IF dispType = 0 THEN
   outV = hp
ELSIF dispType = 1 THEN
   outV = minCorr
ELSIF dispType = 2 THEN
   outV = dc
ELSE
   outV = bp
ENDIF

RETURN outV COLOURED(41, 98, 255) AS "Series", 0 COLOURED(120, 123, 134) STYLE(dottedline2) AS "Zero line"
Conclusion
Most cycle tools ask you to choose the period. The AutoTune Filter measures it on every bar with a rolling autocorrelation and tunes itself accordingly, which makes it a practical way to follow the rhythm of a market as it changes.