




More from ProRealCode
ProRealCode - Trading & Coding with ProRealTime™



ATR Exceedance Probability Model
Introduction
Most volatility tools answer “how big is the move?”. This one answers a different question: how often does price go where the ATR said it would not?
The mechanism is simple enough to state in one line. Draw a level at k · ATR away from the market. Every bar, check whether price cleared it. Write down a 1 if it did and a 0 if it did not. Everything else in the indicator is arithmetic on that column of zeros and ones.
That column turns out to be worth a lot. A volatility estimate that is exceeded 12% of the time on this instrument and this timeframe is behaving normally. The same estimate exceeded 35% of the time is not describing the market any more — and knowing that is far more actionable than knowing the ATR went up, because the ATR always goes up after the move you missed.
Two readings come out of it:
- Is the current rate of breaches unusual? Not “is it high” — unusual for this series.
- Do breaches arrive in clusters? That is, does a breach today make a breach tomorrow more likely than it was to begin with?
Theory Behind the Indicator
1. Two ways to detect a breach, and they are not the same thing
The indicator offers two detection methods. Choosing between them decides what the whole model measures, so it is worth being precise.
True Range vs ATR compares the range of the current bar against the average:
breach = trueRange > k · ATR
This measures size. It fires on a bar that is simply bigger than usual. Nothing wrong with it, but note that the bar being measured is also, through the ATR, part of what it is measured against.
Price vs Previous ATR Level — the default — compares today’s high and low against levels that were set by yesterday’s bar:
breach = high > upperBand[1] or low < lowerBand[1]
This measures surprise. The level existed before price got there. Nobody could have adjusted it after the fact. That distinction is what makes the statistics downstream mean anything: the first method asks whether a bar was large, the second asks whether a bar went somewhere the previous bar’s volatility said it should not have.
The second method is the one the model is built on. The first is there as a sanity check.
2. Two frequencies
The 0/1 series is averaged over two windows:
currentFreq  = mean(breach, 20)  · 100
baselineFreq = mean(breach, 200) · 100
The short one is what is happening. The long one is what normally happens on this instrument. Plotted together with the area between them shaded, they already tell most of the story: the market is running hotter or colder than its own habit.
3. The z-score, and the mistake almost everybody makes reading it
Here is the part worth slowing down for.
The z-score does not compare the short frequency against the long frequency. It compares the short frequency against its own distribution:
z = (currentFreq - mean(currentFreq, 200)) / stdev(currentFreq, 200)
Read the arguments carefully — the mean and the standard deviation are taken over currentFreq itself, not over the raw breach series. So the question being asked is:
Given how this instrument’s 20-bar breach rate normally moves around, is today’s reading far out on that distribution?
That is a different, and better, question than “is the rate above average”. A breach rate of 25% might be routine on a crypto pair and a five-sigma event on a bund future. The z-score normalises by the variability of the rate itself, so the threshold (1.96 by default, the two-sided 95% point of a normal distribution) means roughly the same thing across instruments.
The 1.96 is a convenient reference, not a claim. Breach-rate series are autocorrelated and not normally distributed, so treat it as a threshold that has been calibrated to feel right, not as a p-value.
4. Clustering: the part with the strongest theoretical backing
Volatility clustering is the most robust stylised fact in financial time series. Large moves follow large moves. The indicator measures it directly, by conditioning:
serialBreakProb = P(breach today | breach yesterday)
clusteringEdge  = serialBreakProb - currentFreq
The first is a conditional probability estimated over the short window: of all the bars that came after a breach, what share broke again. The second subtracts the unconditional rate, and that subtraction is what makes the number readable.
The effect is real and it is large. Measured over ten years of daily data on eight instruments (SPY, QQQ, GLD, TLT, EURUSD, BTCUSD, DAX, crude), using the whole sample rather than a rolling window, the conditional probability beats the base rate on every single one. On SPY with the range test, 12.6% of bars breach — but 33.8% of the bars that follow a breach do. On EURUSD, 9.8% against 30.7%. Position sizing built on the unconditional 12.6% is understating risk by a factor of nearly three in exactly the conditions where being wrong is most expensive.
But do not read the on-screen number against zero. The conditional probability is estimated over a 20-bar window, which is a very small denominator, and when the window happens to contain no breach at all the indicator has nothing to divide and reports nothing. That small-sample behaviour pushes the edge down: shuffle the breach series so that the clustering is destroyed and the rate is preserved, and the edge does not settle at 0 — it settles somewhere around -1.5 to -4 points, depending on the instrument. That is where “no clustering” actually sits.
Compared against that shuffled baseline the reading does discriminate: the real series scores above its own shuffled version on seven of the eight instruments with the default detection, and on all eight with the range test, by about five points on average. So the number is informative — it is the origin that is displaced. Watch where the edge usually sits on the instrument you trade and react when it climbs above its own habit, rather than waiting for it to cross zero.
5. Volatility regime
A second z-score, this time on the ATR itself against its own 200-bar distribution, labels the market High Vol, Quiet or Normal. It sits in the dashboard next to the breach statistics, and it is the context in which the rest should be read: a high breach rate during a quiet regime is a very different animal from the same rate during an expansion.
How to Read It
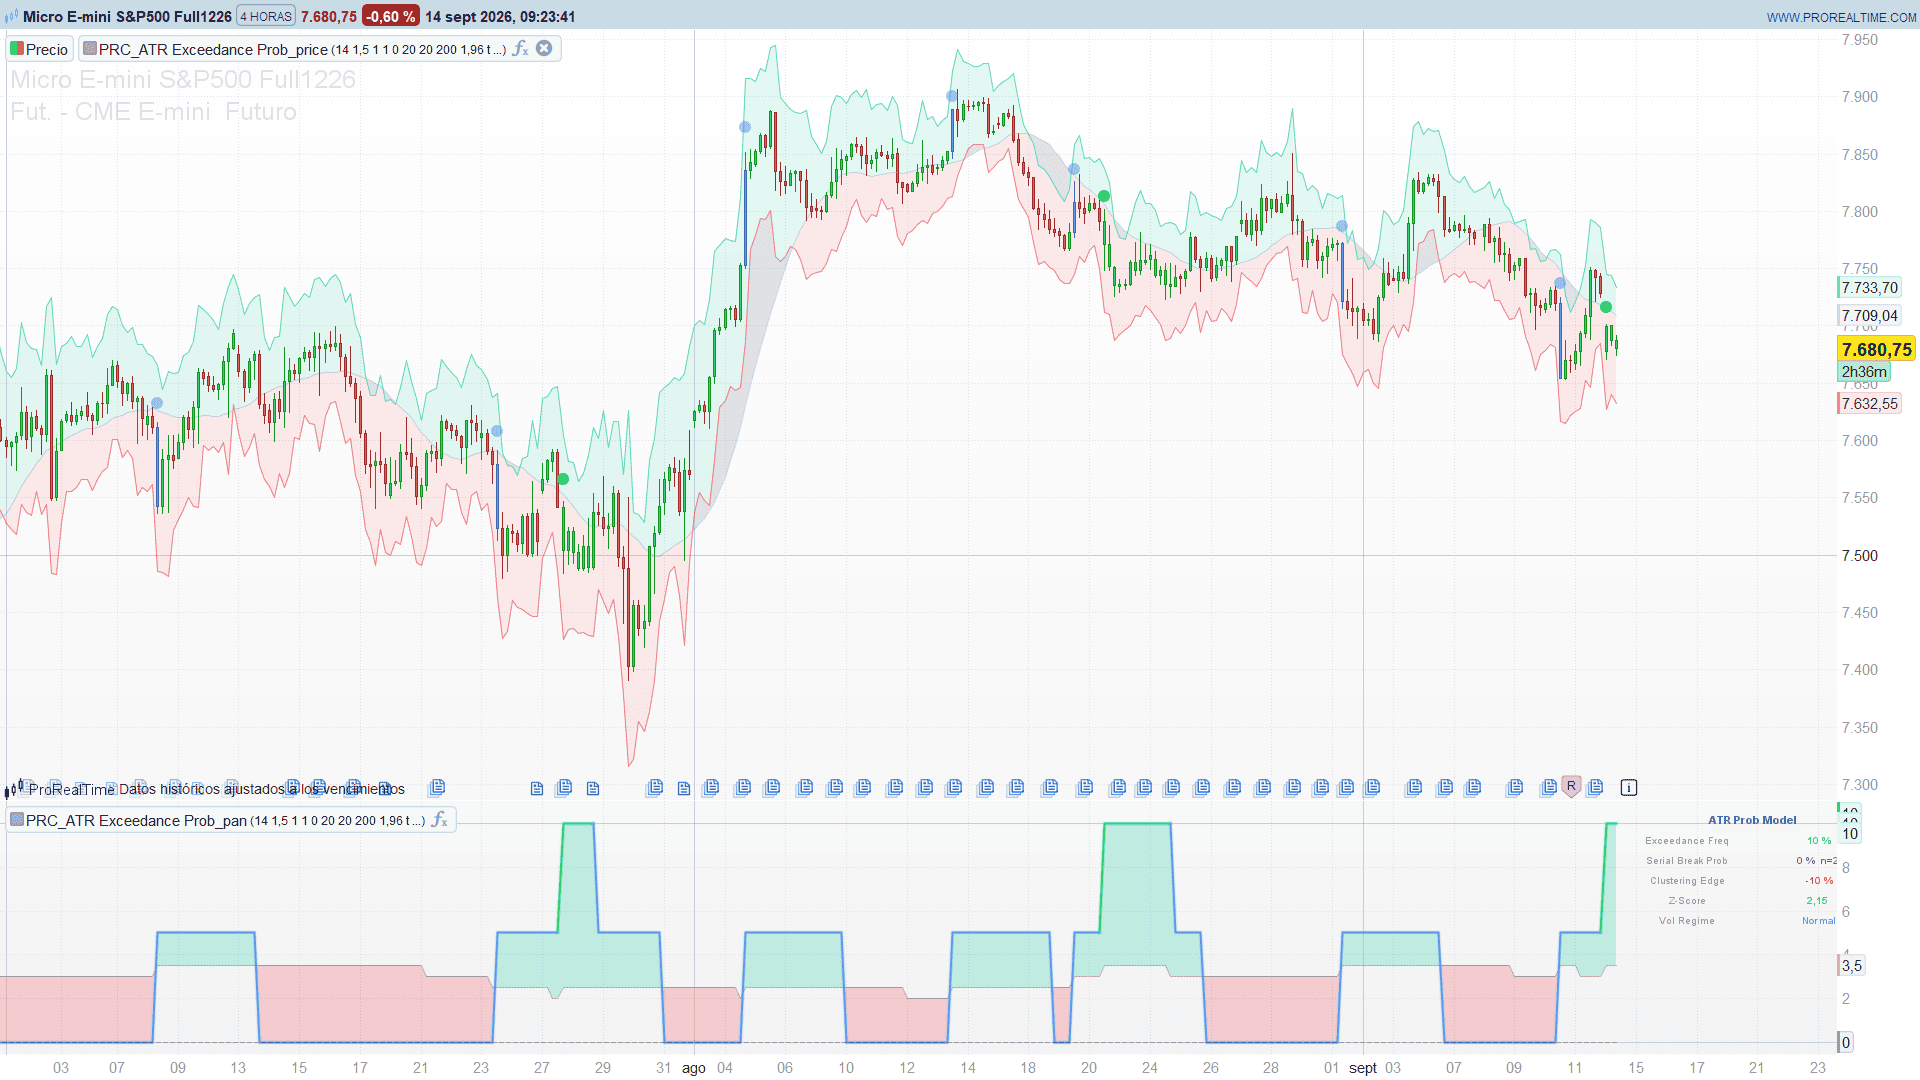
The panel:
- Coloured line — the 20-bar breach frequency. It turns green when its z-score clears +1.96, red when it falls below -1.96, blue otherwise.
- Grey line — the 200-bar baseline. Where the market usually sits.
- Shaded area — green while the recent rate runs above baseline, red while it runs below.
- Dotted line — the serial break probability. Above the coloured line means clustering. It breaks wherever the window holds no breach to condition on: a gap means “no sample”, not “zero”.
The dashboard gives the four numbers plus the regime. Next to the serial break probability it prints n, the number of observations the estimate rests on — with the default settings that is often 0, 1 or 2, and a conditional probability built on one observation is not worth acting on. When n is 0 the row reads n/a rather than showing a figure.
The one to watch is Clustering Edge, read as described above: against its own usual level on that instrument, not against zero. Rising towards and through its habitual band is the state where a volatility stop calibrated on the average gets run over.
On the price chart: the bands, a dot on every bar that breached (bright when the rate itself is statistically unusual, dim otherwise), and the breach bars coloured.
None of this is a directional signal, and it is not meant to be. A breach says price went further than expected; it says nothing at all about which way it goes next. The honest uses are sizing, stop distance, and deciding whether a breakout deserves to be believed.
Settings
ATR Length (14) and ATR Multiplier (1.5) set the level. Raise the multiplier and breaches become rarer and more meaningful; lower it and the series turns into noise. The default is rarer than it looks, and how rare depends on which detection method is running: over ten years of daily data on eight major instruments, the levels-from-the-previous-bar test fires on 1.6% to 7% of bars, while the range test fires on 10% to 14%. That matters, because the first method at k = 1.5 leaves the 20-bar window empty on a third to two thirds of the bars, and the panel goes blank rather than guess. If you want a continuous reading out of the default method, drop the multiplier to 1.0 — that lifts the rate to roughly 7–19% and the window almost always has something in it.
Breach Detection Method (detectMode) — 1 is the levels-from-the-previous-bar test described above, 0 the plain range test.
Short-Term Window (20) and Baseline Window (200). The short one governs how quickly the reading reacts; the long one defines “normal”. Keep them well separated, at least 1:5, or the z-score starts comparing the series against a version of itself and flattens out.
Z-Score Sensitivity (1.96). Lower it to 1.5 for a more talkative indicator, raise it to 2.5 to keep only the extremes.
Clustering baseline (edgeNull, -3). The reading of the clustering edge that means “no clustering”, for the reason given in section 4. The dashboard colours against this level rather than against zero. The default is the middle of the range measured across the eight instruments; to pin it down on yours, watch where the edge settles during quiet stretches and use that.
Bands Mode — 0 draws a classic envelope around a moving average; 1 hangs the levels off each bar’s own high and low, which is what the default detection method reads.
Note the warm-up: the z-score needs atrLen + shortWindow + longWindow bars — 234 with the defaults — before it means anything. The panel says so on the chart until it has them.
ProBuilder Code
An indicator only ever draws inside its own window, so the model ships as two of them. The first goes in a separate panel and holds the statistics; the second goes on the price chart and holds the bands, the markers and the candle colouring. The breach detector is deliberately duplicated so the two windows always agree — if you change atrLen, threshK, detectMode, bandMode, bandMethod or basisLen in one, change it in the other.
Part 1 — Probability panel (apply in a separate window):
//----------------------------------------------
//PRC_ATR Exceedance Probability Model
//version = 0
//11.09.2026
//Ivan Gonzalez @ www.prorealcode.com
//Author: LuxAlgo
//Sharing ProRealTime knowledge
//----------------------------------------------
// PART 1 of 2 - PROBABILITY PANEL. Apply this one in a SEPARATE WINDOW.
// Part 2 ("ATR bands") draws the bands, the breach markers and the candle
// colouring on the price chart. An indicator only ever draws inside its own
// window, so the model travels in two pieces: the breach detector is repeated
// in part 2 so that both windows always tell the same story.
//----------------------------------------------
DEFPARAM drawonlastbaronly = true
//----------------------------------------------
// --- Core settings (declare them as Variables in the editor) ---
//----------------------------------------------
atrLen      = 14    // Lookback for the ATR calculation
threshK     = 1.5   // Multiplier k: the threshold is k * ATR
detectMode  = 1     // 0 = True Range vs ATR, 1 = High/Low vs the PREVIOUS bar levels
//----------------------------------------------
// --- Band definition (must match part 2) ---
//----------------------------------------------
bandMode    = 1     // 0 = basis +/- k*ATR, 1 = high + k*ATR and low - k*ATR
bandMethod  = 0     // Basis: 0 SMA, 1 EMA, 2 WMA, 3 VWMA, 4 LSMA, 5 Price
basisLen    = 20    // Basis period
//----------------------------------------------
// --- Statistical windows ---
//----------------------------------------------
shortWindow = 20    // Short term window: the exceedance frequency you read now
longWindow  = 200   // Baseline window: what "normal" means on this market
confidence  = 1.96  // Z score beyond which the short window counts as significant
//----------------------------------------------
// --- Display ---
//----------------------------------------------
showPanel   = 1     // 1 = draw the dashboard
showGlow    = 1     // 1 = draw the two glow layers under the current frequency
showCont    = 1     // 1 = return the serial break probability as a fourth curve
edgeNull    = 0 - 3 // Clustering Edge reading that means "no clustering" (see note below)
dashX       = 0 - 230   // Panel: pixels from the right edge of the window
dashY       = 0 - 18    // Panel: pixels from the top edge of the window
dashCol     = 132       // Panel: horizontal gap between label and value
//----------------------------------------------
// --- Colours (mid tones: readable on a light and on a dark background) ---
//----------------------------------------------
bullR = 0       // significance / clustering edge in favour
bullG = 200
bullB = 150
bearR = 242     // alert / clustering edge against
bearG = 54
bearB = 69
neutR = 91      // normal reading
neutG = 156
neutB = 246
txtR = 110      // dashboard values
txtG = 110
txtB = 110
labR = 150      // dashboard labels
labG = 150
labB = 150
//----------------------------------------------
//=== 1. TRUE RANGE AND ATR ===
// TR is a reserved word, hence trueRng. The first bar has no close[1] to work
// with, so it falls back to the plain high - low range.
//----------------------------------------------
IF barindex < 1 THEN
   trueRng = high - low
ELSE
   trueRng = max(high, close[1]) - min(low, close[1])
ENDIF

atrVal = averagetruerange[atrLen]
//----------------------------------------------
//=== 2. BASIS FOR THE BANDS ===
// VWMA has no native here, so it is written out. On an instrument with no
// volume the sum is zero, so it degrades to a plain SMA instead of dividing by
// zero.
//----------------------------------------------
IF bandMethod = 1 THEN
   basisV = average[basisLen,1](close)
ELSIF bandMethod = 2 THEN
   basisV = weightedaverage[basisLen](close)
ELSIF bandMethod = 3 THEN
   volSum = summation[basisLen](volume)
   IF volSum > 0 THEN
      basisV = summation[basisLen](close * volume) / volSum
   ELSE
      basisV = average[basisLen](close)
   ENDIF
ELSIF bandMethod = 4 THEN
   basisV = average[basisLen,5](close)
ELSIF bandMethod = 5 THEN
   basisV = close
ELSE
   basisV = average[basisLen](close)
ENDIF
//----------------------------------------------
//=== 3. BANDS ===
//----------------------------------------------
IF bandMode = 0 THEN
   bandUp = basisV + atrVal * threshK
   bandDn = basisV - atrVal * threshK
ELSE
   bandUp = high + atrVal * threshK
   bandDn = low - atrVal * threshK
ENDIF
//----------------------------------------------
//=== 4. BREACH DETECTION ===
// Mode 1 reads the levels of the PREVIOUS bar, so it answers "did price go
// where yesterday's volatility said it would not", which is the question the
// whole model is built on. Mode 0 only measures the size of the current bar.
// During the ATR warm-up atrVal is undefined, so the bar is forced to 0: an
// undefined dragged into the moving averages below would poison 200 bars of
// statistics.
//----------------------------------------------
exceedVal = 0

IF barindex >= atrLen + 1 THEN
   IF detectMode = 0 THEN
      IF trueRng > atrVal * threshK THEN
         exceedVal = 1
      ENDIF
   ELSE
      IF high > bandUp[1] OR low < bandDn[1] THEN
         exceedVal = 1
      ENDIF
   ENDIF
ENDIF
//----------------------------------------------
//=== 5. FREQUENCIES AND Z SCORE ===
// freqNow is the share of breaches in the recent window, freqBase the same
// over the long window. The z score does NOT compare freqNow against freqBase:
// it compares it against its own distribution, so it answers "is the current
// rate unusual FOR THIS SERIES", not "is it above average".
//----------------------------------------------
freqNow  = average[shortWindow](exceedVal) * 100
freqBase = average[longWindow](exceedVal) * 100

baseMean = average[longWindow](freqNow)
baseDev  = STD[longWindow](freqNow)

warmBars = atrLen + shortWindow + longWindow

ready = 0
IF barindex >= warmBars THEN
   ready = 1
ENDIF

zScore = 0
IF ready = 1 THEN
   IF baseDev > 0 THEN
      zScore = (freqNow - baseMean) / baseDev
   ENDIF
ENDIF
//----------------------------------------------
//=== 6. SERIAL BREAK PROBABILITY ===
// The original runs a loop over the short window counting pairs: how many bars
// had a breach on the previous bar, and how many of those had one again. Both
// counters are plain sums of a 0/1 series, so the loop collapses into two
// SUMMATION calls: countPrev sums the shifted series, countCont sums the
// product, which for 0/1 values is the logical AND of the pair.
//----------------------------------------------
prevExc = 0
contExc = 0

IF barindex >= 1 THEN
   prevExc = exceedVal[1]
   contExc = exceedVal * exceedVal[1]
ENDIF

countPrev = summation[shortWindow](prevExc)
countCont = summation[shortWindow](contExc)

// countPrev is the SAMPLE the conditional probability rests on: with a rare
// threshold it is 0 on half the bars, and a ratio with no denominator is not a
// probability. hasSample says whether there is anything to divide, and the
// panel and the dashboard go blank instead of printing a 0 that would read as
// "no clustering" when it means "no data".
hasSample = 0
probCont = 0
IF countPrev > 0 THEN
   hasSample = 1
   probCont = countCont / countPrev * 100
ENDIF

// The clustering edge: how much more likely a breach is right after another one
// than at any random moment.
//
// CAREFUL WITH THE ZERO. Over a 20-bar window this ratio carries a negative
// bias of a few points: take the breach series, shuffle it so that any
// clustering is destroyed and the rate is preserved, recompute, and the edge
// does not land on 0 - it lands between -1.5 and -4 depending on the
// instrument. That, and not zero, is where "no clustering" sits. Measured over
// ten years of daily data on eight instruments, with 200 shuffles each.
//
// edgeNull carries that level, and it is what the dashboard colours against.
// The default of -3 is the middle of the measured range; if you want it exact
// for your instrument, watch where the edge sits during quiet stretches.
clustEdge = probCont - freqNow
//----------------------------------------------
//=== 7. VOLATILITY REGIME ===
// The ATR measured against its own 200-bar distribution. It says whether the
// market is expanding or resting, which is the context the breach statistics
// above have to be read in.
//----------------------------------------------
atrMean = average[longWindow](atrVal)
atrDev  = STD[longWindow](atrVal)

atrZ = 0
IF ready = 1 THEN
   IF atrDev > 0 THEN
      atrZ = (atrVal - atrMean) / atrDev
   ENDIF
ENDIF
//----------------------------------------------
//=== 8. COLOURS OF THE CURRENT FREQUENCY LINE ===
// Resolved before the return, which only takes plain variables.
//----------------------------------------------
IF zScore > confidence THEN
   cR = bullR
   cG = bullG
   cB = bullB
ELSIF zScore < 0 - confidence THEN
   cR = bearR
   cG = bearG
   cB = bearB
ELSE
   cR = neutR
   cG = neutG
   cB = neutB
ENDIF

// Glow layers: same colour, wide and nearly transparent. Switched off with the
// alpha channel rather than with undefined, so the curve never drags a flat
// segment across the window.
gA1 = 0
gA2 = 0
IF showGlow = 1 THEN
   gA1 = 46
   gA2 = 26
ENDIF

contA = 0
IF showCont = 1 THEN
   contA = 190
ENDIF
//----------------------------------------------
//=== 9. SERIES AND FILL ===
// Both curves are switched off together during the warm-up. COLORBETWEEN
// bridges a gap where only ONE of the two series is undefined and paints a
// vertical band across the window, so they have to go dark on the same bar.
//----------------------------------------------
IF ready = 1 THEN
   plotNow  = freqNow
   plotBase = freqBase
ELSE
   plotNow  = undefined
   plotBase = undefined
ENDIF

plotCont = undefined
IF ready = 1 AND showCont = 1 AND hasSample = 1 THEN
   plotCont = probCont
ENDIF

glow1 = plotNow
glow2 = plotNow

// The fill reads "the recent rate is above / below its own baseline": one
// colour per fill, so what it carries is the sign.
IF freqNow > freqBase THEN
   fR = bullR
   fG = bullG
   fB = bullB
ELSE
   fR = bearR
   fG = bearG
   fB = bearB
ENDIF

COLORBETWEEN(plotNow, plotBase, fR, fG, fB, 55)
//----------------------------------------------
//=== 10. DASHBOARD ===
// Anchored to the window in pixels, so it does not move with the zoom or with
// the price scale. If a row runs into the scale, lower dashX.
//----------------------------------------------
IF showPanel = 1 AND ready = 1 THEN

   freqTxt  = round(freqNow * 100) / 100
   contTxt  = round(probCont * 100) / 100
   edgeTxt  = round(clustEdge * 100) / 100
   zTxt     = round(zScore * 100) / 100
   nSamp    = round(countPrev)

   DRAWTEXT("ATR Prob Model", dashX + 66, dashY, sansserif, bold, 11) COLOURED(txtR, txtG, txtB, 255) ANCHOR(topright, xshift, yshift)

   // Exceedance frequency, coloured by significance
   DRAWTEXT("Exceedance Freq", dashX, dashY - 20, sansserif, standard, 10) COLOURED(labR, labG, labB, 255) ANCHOR(topright, xshift, yshift)
   DRAWTEXT("#freqTxt#%", dashX + dashCol, dashY - 20, sansserif, bold, 10) COLOURED(cR, cG, cB, 255) ANCHOR(topright, xshift, yshift)

   // Serial break probability: green when the edge clears the no-clustering level
   IF clustEdge > edgeNull THEN
      pR = bullR
      pG = bullG
      pB = bullB
   ELSE
      pR = txtR
      pG = txtG
      pB = txtB
   ENDIF
   DRAWTEXT("Serial Break Prob", dashX, dashY - 40, sansserif, standard, 10) COLOURED(labR, labG, labB, 255) ANCHOR(topright, xshift, yshift)
   IF hasSample = 1 THEN
      DRAWTEXT("#contTxt#%  n=#nSamp#", dashX + dashCol, dashY - 40, sansserif, bold, 10) COLOURED(pR, pG, pB, 255) ANCHOR(topright, xshift, yshift)
   ELSE
      DRAWTEXT("n/a  n=0", dashX + dashCol, dashY - 40, sansserif, bold, 10) COLOURED(labR, labG, labB, 255) ANCHOR(topright, xshift, yshift)
   ENDIF

   // Clustering edge, read against edgeNull and NOT against zero
   IF clustEdge > edgeNull THEN
      eR = bullR
      eG = bullG
      eB = bullB
   ELSE
      eR = bearR
      eG = bearG
      eB = bearB
   ENDIF
   DRAWTEXT("Clustering Edge", dashX, dashY - 60, sansserif, standard, 10) COLOURED(labR, labG, labB, 255) ANCHOR(topright, xshift, yshift)
   IF hasSample = 1 THEN
      DRAWTEXT("#edgeTxt#%", dashX + dashCol, dashY - 60, sansserif, bold, 10) COLOURED(eR, eG, eB, 255) ANCHOR(topright, xshift, yshift)
   ELSE
      DRAWTEXT("n/a", dashX + dashCol, dashY - 60, sansserif, bold, 10) COLOURED(labR, labG, labB, 255) ANCHOR(topright, xshift, yshift)
   ENDIF

   // Z score
   IF abs(zScore) > confidence THEN
      zR = bullR
      zG = bullG
      zB = bullB
   ELSE
      zR = txtR
      zG = txtG
      zB = txtB
   ENDIF
   DRAWTEXT("Z-Score", dashX, dashY - 80, sansserif, standard, 10) COLOURED(labR, labG, labB, 255) ANCHOR(topright, xshift, yshift)
   DRAWTEXT("#zTxt#", dashX + dashCol, dashY - 80, sansserif, bold, 10) COLOURED(zR, zG, zB, 255) ANCHOR(topright, xshift, yshift)

   // Volatility regime
   DRAWTEXT("Vol Regime", dashX, dashY - 100, sansserif, standard, 10) COLOURED(labR, labG, labB, 255) ANCHOR(topright, xshift, yshift)
   IF atrZ > 1 THEN
      DRAWTEXT("High Vol", dashX + dashCol, dashY - 100, sansserif, bold, 10) COLOURED(bearR, bearG, bearB, 255) ANCHOR(topright, xshift, yshift)
   ELSIF atrZ < 0 - 1 THEN
      DRAWTEXT("Quiet", dashX + dashCol, dashY - 100, sansserif, bold, 10) COLOURED(bullR, bullG, bullB, 255) ANCHOR(topright, xshift, yshift)
   ELSE
      DRAWTEXT("Normal", dashX + dashCol, dashY - 100, sansserif, bold, 10) COLOURED(neutR, neutG, neutB, 255) ANCHOR(topright, xshift, yshift)
   ENDIF

ELSIF showPanel = 1 AND islastbarupdate THEN

   //----------------------------------------------
   // Not enough history: the z score needs atrLen + shortWindow + longWindow
   // bars before it means anything. Without this the panel would just come up
   // empty and look broken.
   //----------------------------------------------
   DRAWTEXT("ATR Prob Model", dashX + 66, dashY, sansserif, bold, 11) COLOURED(txtR, txtG, txtB, 255) ANCHOR(topright, xshift, yshift)
   DRAWTEXT("Not enough history: needs #warmBars# bars", dashX + 66, dashY - 20, sansserif, standard, 10) COLOURED(bearR, bearG, bearB, 255) ANCHOR(topright, xshift, yshift)

ENDIF
//----------------------------------------------
//=== 11. RETURN ===
// Glow layers first so the thin coloured line is drawn on top of them.
//----------------------------------------------
RETURN glow2 COLOURED(cR, cG, cB, gA2) STYLE(line, 5) AS "Glow outer", glow1 COLOURED(cR, cG, cB, gA1) STYLE(line, 3) AS "Glow inner", plotBase COLOURED(140, 140, 140, 160) STYLE(line, 1) AS "Baseline Frequency", plotNow COLOURED(cR, cG, cB, 255) STYLE(line, 2) AS "Current Frequency", plotCont COLOURED(txtR, txtG, txtB, contA) STYLE(dottedline, 1) AS "Serial Break Prob"
Part 2 — ATR bands (apply on the price chart):
//----------------------------------------------
//PRC_ATR Exceedance Probability Model
//version = 0
//11.09.2026
//Ivan Gonzalez @ www.prorealcode.com
//Author: LuxAlgo
//Sharing ProRealTime knowledge
//----------------------------------------------
// PART 2 of 2 - ATR BANDS. Apply this one ON THE PRICE CHART.
// Part 1 ("probability panel") holds the frequencies, the z score and the
// dashboard. An indicator only ever draws inside its own window, so the model
// has to travel in two pieces.
//
// The breach detector below is a copy of the one in part 1, on purpose: the
// two windows must agree on which bar is a breach. If you change atrLen,
// threshK, detectMode, bandMode, bandMethod or basisLen here, change them
// there too.
//----------------------------------------------
// --- Core settings (declare them as Variables in the editor) ---
//----------------------------------------------
atrLen      = 14    // Lookback for the ATR calculation
threshK     = 1.5   // Multiplier k: the threshold is k * ATR
detectMode  = 1     // 0 = True Range vs ATR, 1 = High/Low vs the PREVIOUS bar levels
//----------------------------------------------
// --- Band definition ---
//----------------------------------------------
bandMode    = 1     // 0 = basis +/- k*ATR, 1 = high + k*ATR and low - k*ATR
bandMethod  = 0     // Basis: 0 SMA, 1 EMA, 2 WMA, 3 VWMA, 4 LSMA, 5 Price
basisLen    = 20    // Basis period
//----------------------------------------------
// --- Statistical windows (only used to flag the significant breaches) ---
//----------------------------------------------
shortWindow = 20    // Short term window
longWindow  = 200   // Baseline window
confidence  = 1.96  // Z score beyond which a breach is drawn as significant
//----------------------------------------------
// --- Display ---
//----------------------------------------------
showMarks   = 1     // 1 = dot above the bars that breached the level
candleMode  = 1     // 0 = no candle colouring, 1 = breach bars only, 2 = every bar
markOff     = 0.5   // Dot distance above the high, in ATRs
//----------------------------------------------
// --- Colours (mid tones: readable on a light and on a dark background) ---
//----------------------------------------------
bullR = 0       // significant breach
bullG = 200
bullB = 150
bearR = 242     // lower band
bearG = 54
bearB = 69
neutR = 91      // ordinary breach
neutG = 156
neutB = 246
dimR = 96       // bars with nothing to say (candleMode 2)
dimG = 125
dimB = 139
//----------------------------------------------
//=== 1. TRUE RANGE AND ATR ===
// TR is a reserved word, hence trueRng.
//----------------------------------------------
IF barindex < 1 THEN
   trueRng = high - low
ELSE
   trueRng = max(high, close[1]) - min(low, close[1])
ENDIF

atrVal = averagetruerange[atrLen]
//----------------------------------------------
//=== 2. BASIS FOR THE BANDS ===
//----------------------------------------------
IF bandMethod = 1 THEN
   basisV = average[basisLen,1](close)
ELSIF bandMethod = 2 THEN
   basisV = weightedaverage[basisLen](close)
ELSIF bandMethod = 3 THEN
   volSum = summation[basisLen](volume)
   IF volSum > 0 THEN
      basisV = summation[basisLen](close * volume) / volSum
   ELSE
      basisV = average[basisLen](close)
   ENDIF
ELSIF bandMethod = 4 THEN
   basisV = average[basisLen,5](close)
ELSIF bandMethod = 5 THEN
   basisV = close
ELSE
   basisV = average[basisLen](close)
ENDIF
//----------------------------------------------
//=== 3. BANDS ===
// Mode 0 is a classic envelope around the basis. Mode 1 hangs the level off
// the high and the low of each bar, which is what the breach test in mode 1
// reads on the next bar: "the level yesterday's range and volatility set".
//----------------------------------------------
IF bandMode = 0 THEN
   bandUp = basisV + atrVal * threshK
   bandDn = basisV - atrVal * threshK
ELSE
   bandUp = high + atrVal * threshK
   bandDn = low - atrVal * threshK
ENDIF
//----------------------------------------------
//=== 4. BREACH DETECTION (identical to part 1) ===
//----------------------------------------------
exceedVal = 0

IF barindex >= atrLen + 1 THEN
   IF detectMode = 0 THEN
      IF trueRng > atrVal * threshK THEN
         exceedVal = 1
      ENDIF
   ELSE
      IF high > bandUp[1] OR low < bandDn[1] THEN
         exceedVal = 1
      ENDIF
   ENDIF
ENDIF
//----------------------------------------------
//=== 5. Z SCORE (identical to part 1) ===
//----------------------------------------------
freqNow  = average[shortWindow](exceedVal) * 100
baseMean = average[longWindow](freqNow)
baseDev  = STD[longWindow](freqNow)

warmBars = atrLen + shortWindow + longWindow

ready = 0
IF barindex >= warmBars THEN
   ready = 1
ENDIF

zScore = 0
IF ready = 1 THEN
   IF baseDev > 0 THEN
      zScore = (freqNow - baseMean) / baseDev
   ENDIF
ENDIF

// A breach is "significant" when the RATE of breaches is unusual, not when the
// breach itself is big: the dot says the market is in a regime that produces
// more breaks than its own normal, which is the point of the whole model.
signif = 0
IF zScore > confidence THEN
   signif = 1
ENDIF
//----------------------------------------------
//=== 6. MARKERS ===
// One dot per breach, above the bar that did it. The point radius has to be a
// literal number.
//----------------------------------------------
IF showMarks = 1 AND exceedVal = 1 THEN
   markY = high + atrVal * markOff
   IF signif = 1 THEN
      DRAWPOINT(barindex, markY, 3) COLOURED(bullR, bullG, bullB, 255)
   ELSE
      DRAWPOINT(barindex, markY, 3) COLOURED(neutR, neutG, neutB, 140)
   ENDIF
ENDIF
//----------------------------------------------
//=== 7. CANDLE COLOURING ===
// The chart candle is redrawn on top of itself with DRAWCANDLE. Mode 2 paints
// every bar and dims the quiet ones, but that is one drawing object per bar and
// it gets heavy on a long chart; mode 1 paints only the breaches and leaves the
// rest alone. Either way the chart candles are still underneath: switch to a
// light background or to bars if an outline shows through.
//----------------------------------------------
IF candleMode > 0 THEN
   IF signif = 1 THEN
      DRAWCANDLE(open, high, low, close) COLOURED(bullR, bullG, bullB, 255)
   ELSIF exceedVal = 1 THEN
      DRAWCANDLE(open, high, low, close) COLOURED(neutR, neutG, neutB, 255)
   ELSIF candleMode = 2 THEN
      DRAWCANDLE(open, high, low, close) COLOURED(dimR, dimG, dimB, 64)
   ENDIF
ENDIF
//----------------------------------------------
//=== 8. BAND FILLS ===
//----------------------------------------------
COLORBETWEEN(basisV, bandUp, bullR, bullG, bullB, 26)
COLORBETWEEN(basisV, bandDn, bearR, bearG, bearB, 26)
//----------------------------------------------
//=== 9. RETURN ===
//----------------------------------------------
RETURN basisV COLOURED(neutR, neutG, neutB, 90) STYLE(line, 1) AS "Bands Basis", bandUp COLOURED(bullR, bullG, bullB, 160) STYLE(line, 1) AS "Upper Band", bandDn COLOURED(bearR, bearG, bearB, 160) STYLE(line, 1) AS "Lower Band"
Closing
The idea worth keeping, even if you never load the indicator, is the one in section 4. Volatility measures are usually consumed as a single number — the ATR is 32 points, so the stop goes at 48. That number is an average, and averages are exactly the wrong summary for a process that clusters. The breach rate tells you how often the average has been failing lately, and the clustering edge tells you whether the failures come in bursts. Both are cheap to compute and neither is in your standard toolkit.
Two cautions, both about sample size, because that is where this class of indicator breaks.
The z-score: breach-rate series are strongly autocorrelated, so the effective sample behind that 200-bar standard deviation is much smaller than 200. The threshold is a well-chosen heuristic, not a significance test, and it should be read as “unusually high for this series” rather than “significant at 5%”.
The clustering edge: a conditional probability over a 20-bar window, on an event that fires a few percent of the time, is estimated on a handful of observations or none at all. That is why the panel prints the sample size and blanks the row when there is nothing to divide, and why the baseline for “no clustering” is a few points below zero rather than at it. Any indicator that reports a conditional probability from a short window has this problem; most of them do not tell you.