





Adaptive Choppiness Index
Introduction
The Choppiness Index measures how much a market wanders compared with how far it actually travels. It adds up the true range of the last N bars and compares that path with the distance between the highest high and the lowest low of the same bars. When price covers a lot of ground bar after bar but ends up inside a narrow box, the reading is high; when most of that movement goes in one direction, the reading is low.
The weak point of the classic version is the fixed N. Fourteen bars can be a whole swing in one market and a fraction of one in another, and the same instrument changes rhythm from one month to the next.
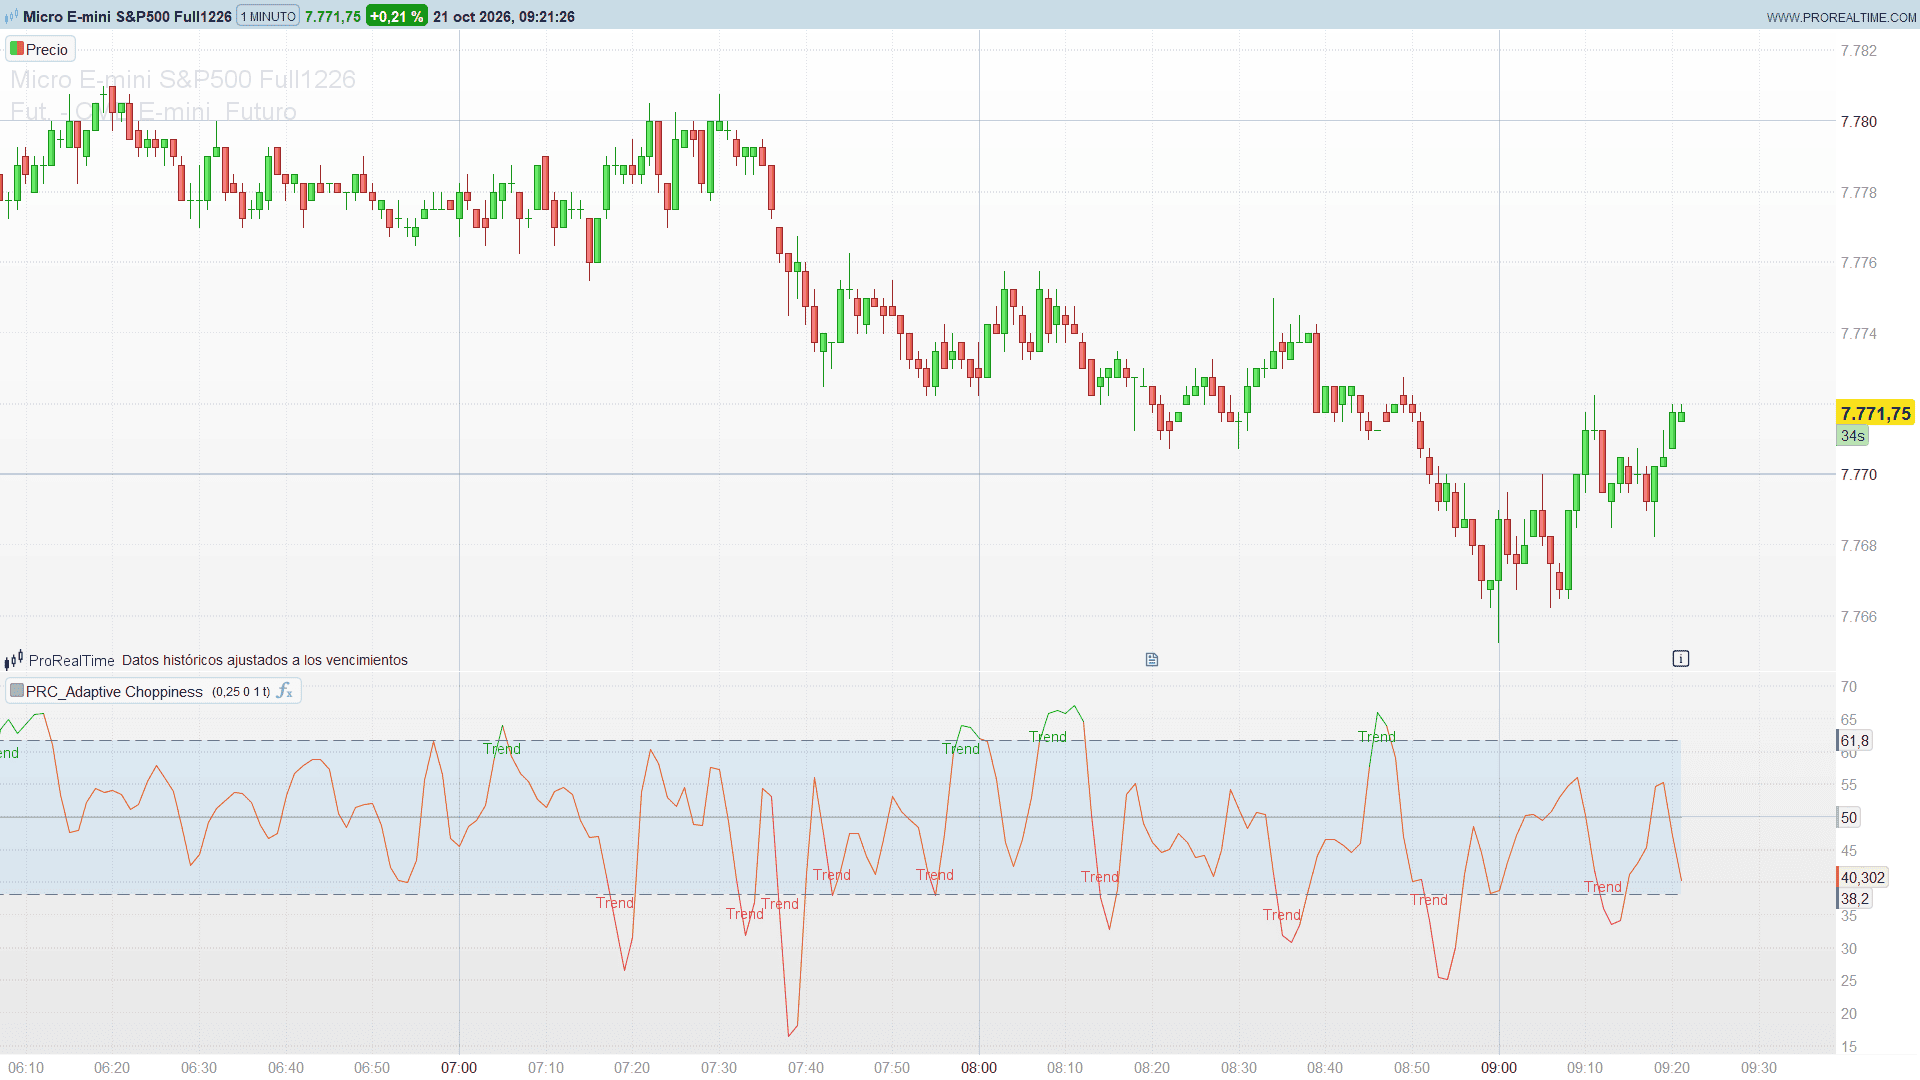
The Adaptive Choppiness Index by blackcat1402 removes that fixed length. On every bar it measures the dominant cycle of the market with John Ehlers’ Homodyne Discriminator and uses a fraction of that cycle as the length of the Choppiness Index. The result is smoothed with an ALMA and drawn between the classic 38.2 and 61.8 levels. The line takes the colour of the zone it is in, and a “Trend” label marks the start of every trend zone.
Theory Behind the Indicator
1. The dominant cycle (Homodyne Discriminator)
Ehlers’ Homodyne Discriminator estimates the period of the dominant market cycle in a few steps:
- the price is smoothed with a 4-bar weighted average and passed through a Hilbert transform, which gives an in-phase (I) and a quadrature (Q) component;
- each bar’s complex value (I, Q) is multiplied by the complex conjugate of the previous bar’s value. The angle of that product is the phase change per bar, and 360 degrees divided by that angle is the cycle period;
- the period is not allowed to jump more than 50% up or 33% down from one bar to the next, is kept between 6 and 50 bars, and is smoothed twice.
The indicator multiplies this smoothed period by the Cycle Participation (0.25 by default), rounds it up and keeps it between 1 and 34 bars. With the default setting the length moves roughly between 2 and 13 bars: a quarter of the measured cycle.
2. The Choppiness Index with that length
With N the length from step 1:
CHOP = 100 * log10( sum of the true range of N bars / (highest high of N bars - lowest low of N bars) ) / log10(N)
The sum of the true ranges is the total path travelled; the high-low range is the net box. Their ratio goes from 1 (every bar moves in the same direction, path = box) to N (the market goes back and forth over the same box). Dividing the logarithm of the ratio by the logarithm of N maps it onto a 0 to 100 scale.
3. ALMA smoothing
Because the length changes from bar to bar, the raw reading is jumpy. It is smoothed with an Arnaud Legoux Moving Average of 5 bars, offset 0.85 and sigma 6: Gaussian weights centred near the most recent bar, so the smoothing adds very little lag.
When the length is a single bar, or the range is completely flat, the index has no value, and the line stays empty until 5 consecutive bars have one again.
Key Features at a Glance
- Choppiness Index with an adaptive length taken from Ehlers’ dominant cycle.
- ALMA(5, 0.85, 6) smoothing.
- Levels at 61.8 and 38.2 (dashed) and 50 (middle line), with a light blue band between 38.2 and 61.8.
- The line is coloured by zone: green above 61.8, red below 38.2, orange in between.
- “Trend” labels at the first bar of every trend zone (green under the line above 61.8, red over the line below 38.2). They can also be shown on every bar, with “Sideways” in between, or switched off.
- Offset to shift the line to the right.
How to Read the Indicator
- Inside the blue band (38.2 to 61.8). The line is orange, the “Sideways” zone: the market is neither clearly directional nor clearly rotating at the scale of its current cycle.
- Below 38.2. The path over the last N bars is close to the net distance travelled: price is moving in one direction. The line turns red and a “Trend” label marks where the zone starts.
- Above 61.8. The line turns green and the author labels this zone “Trend” as well. Keep in mind that in the classic reading of the Choppiness Index high values mean the opposite: a lot of back-and-forth inside a narrow range, typical of consolidation before a breakout. Read it as “the market has left the neutral band”, and use price to see in which direction.
- The length is short. With the default Cycle Participation of 0.25 the index looks back only a few bars, so it reacts fast and crosses the levels often. Raise the Cycle Participation for a slower, steadier reading.
Practical Applications
- Regime filter. Only take trend-following signals while the index is outside the blue band, and range or mean-reversion ideas while it is inside.
- Breakout watch. A long stay above 61.8 (a lot of movement, little net progress) often precedes a range breakout. The direction comes from price, not from the index.
- Alerts. Create a ProRealTime alert on the CHOP line crossing 61.8 or 38.2 to be notified when the regime changes.
Indicator Configuration
All parameters sit at the top of the code. Declare them as variables to change them from the indicator settings:
- cycPart (default: 0.25): Cycle Participation, the fraction of the dominant cycle used as the Choppiness length. The length is always kept between 1 and 34 bars.
- offsetValue (default: 0): shifts the CHOP line N bars to the right. Values below 0 count as 0.
- labelMode (default: 1): 0 hides the labels, 1 writes “Trend” at the first bar of every trend zone, 2 labels every bar (“Trend” or “Sideways”). Labels are drawn on the last 500 bars.
- colorLine (default: 1): 1 colours the line by zone, 0 draws a single gold line.
Code
//--------------------------------------------
// PRC_Adaptive Choppiness
// version = 0
// 14.10.2026
// Ivan Gonzalez @ www.prorealcode.com
// Author: blackcat1402
// Sharing ProRealTime knowledge
//--------------------------------------------
// Choppiness Index whose length follows the dominant cycle
// measured with Ehlers' Homodyne Discriminator, smoothed with
// an ALMA(5, 0.85, 6). Above 61.8 and below 38.2 the bar is in
// a "Trend" zone; in between, "Sideways".
//--------------------------------------------
DEFPARAM DRAWONLASTBARONLY = true

//=== INPUTS (declare as Variables in the editor) ===
cycPart     = 0.25   // Cycle Participation (fraction of the dominant cycle)
offsetValue = 0      // Shifts the CHOP line N bars to the right
labelMode   = 1      // 0 = no labels, 1 = where a Trend zone starts, 2 = every bar
colorLine   = 1      // 1 = line coloured by zone, 0 = single gold line

//=== DOMINANT CYCLE: EHLERS HOMODYNE DISCRIMINATOR ===
// Every state starts at zero and the previous bar of a missing
// history counts as zero, as in the original library.
IF barindex = 0 THEN
   prevI2 = 0
   prevQ2 = 0
   prevRe = 0
   prevIm = 0
   prevPer = 0
   prevSmPer = 0
ELSE
   prevI2 = hdI2[1]
   prevQ2 = hdQ2[1]
   prevRe = hdRe[1]
   prevIm = hdIm[1]
   prevPer = hdPer[1]
   prevSmPer = hdSmPer[1]
ENDIF
hdGain = 0.075 * prevPer + 0.54

hdSmooth = 0
hdDetr = 0
hdQ1 = 0
hdI1 = 0
hdJI = 0
hdJQ = 0
IF barindex > 5 THEN
   // Hilbert transform of the 4-bar weighted price
   hdSmooth = (4 * close + 3 * close[1] + 2 * close[2] + close[3]) / 10
   hdDetr = (0.0962 * hdSmooth + 0.5769 * hdSmooth[2] - 0.5769 * hdSmooth[4] - 0.0962 * hdSmooth[6]) * hdGain
   // In-phase and quadrature components
   hdQ1 = (0.0962 * hdDetr + 0.5769 * hdDetr[2] - 0.5769 * hdDetr[4] - 0.0962 * hdDetr[6]) * hdGain
   hdI1 = hdDetr[3]
   // Advance the phase of I1 and Q1 by 90 degrees
   hdJI = (0.0962 * hdI1 + 0.5769 * hdI1[2] - 0.5769 * hdI1[4] - 0.0962 * hdI1[6]) * hdGain
   hdJQ = (0.0962 * hdQ1 + 0.5769 * hdQ1[2] - 0.5769 * hdQ1[4] - 0.0962 * hdQ1[6]) * hdGain
ENDIF

// Phasor addition for 3-bar averaging, smoothed before the discriminator
hdI2 = 0.2 * (hdI1 - hdJQ) + 0.8 * prevI2
hdQ2 = 0.2 * (hdQ1 + hdJI) + 0.8 * prevQ2

// Homodyne discriminator
hdRe = 0.2 * (hdI2 * prevI2 + hdQ2 * prevQ2) + 0.8 * prevRe
hdIm = 0.2 * (hdI2 * prevQ2 - hdQ2 * prevI2) + 0.8 * prevIm

hdRaw = 0
IF abs(hdIm) > 0 AND abs(hdRe) > 0 THEN
   // ATAN returns degrees: 360 / atan in degrees = 2 * pi / atan in radians
   hdRaw = 360 / ATAN(hdIm / hdRe)
ENDIF
IF hdRaw > 1.5 * prevPer THEN
   hdRaw = 1.5 * prevPer
ENDIF
IF 0.67 * prevPer > hdRaw THEN
   hdRaw = 0.67 * prevPer
ENDIF
// Keep the period between 6 and 50 bars
IF 6 > hdRaw THEN
   hdRaw = 6
ENDIF
IF hdRaw > 50 THEN
   hdRaw = 50
ENDIF
hdPer = 0.2 * hdRaw + 0.8 * prevPer
hdSmPer = 0.33 * hdPer + 0.67 * prevSmPer

// Length = cycle participation x smoothed period, rounded up, 1 to 34 bars
domCycle = ceil(cycPart * hdSmPer)
IF domCycle > 34 THEN
   domCycle = 34
ENDIF
IF 1 > domCycle THEN
   domCycle = 1
ENDIF

//=== ADAPTIVE CHOPPINESS INDEX ===
chopLen = domCycle
trSum = summation[chopLen](tr)
hiLo = highest[chopLen](high) - lowest[chopLen](low)

// A one-bar length or a flat range has no value (division by zero)
chopOk = 0
chopRaw = 0
IF chopLen > 1 AND hiLo > 0 AND trSum > 0 THEN
   chopOk = 1
   // log10(a) / log10(b) is the same ratio as log(a) / log(b)
   chopRaw = 100 * LOG(trSum / hiLo) / LOG(chopLen)
ENDIF

//=== ALMA(5, 0.85, 6) SMOOTHING ===
// Gaussian weights centred at 0.85 x (5 - 1) = 3.4, sigma = 5 / 6.
// A bar without value inside the 5-bar window leaves the ALMA empty.
almaOk = 0
IF barindex >= 4 THEN
   IF summation[5](chopOk) = 5 THEN
      almaOk = 1
   ENDIF
ENDIF
IF almaOk = 1 THEN
   almaM = 0.85 * 4
   almaS = 5 / 6
   wSum = 0
   wNorm = 0
   FOR kW = 0 TO 4 DO
      wK = EXP(-((kW - almaM) * (kW - almaM)) / (2 * almaS * almaS))
      wSum = wSum + wK * chopRaw[4 - kW]
      wNorm = wNorm + wK
   NEXT
   aChop = wSum / wNorm
ELSIF barindex = 0 THEN
   aChop = 50
ELSE
   // No value: keep the last one, hidden (alpha 0)
   aChop = aChop[1]
ENDIF

//=== ZONE OF EACH BAR ===
// 1 = Trend above 61.8, -1 = Trend below 38.2, 0 = Sideways, 9 = no value
upperBand = 61.8
lowerBand = 38.2
chopSt = 9
IF almaOk = 1 THEN
   IF aChop > upperBand THEN
      chopSt = 1
   ELSIF lowerBand > aChop THEN
      chopSt = -1
   ELSE
      chopSt = 0
   ENDIF
ENDIF

//=== PLOT ===
// Hidden while empty and on the first bar after a gap, so that no
// segment is drawn from the held value
offBars = max(0, round(offsetValue))
shown = 50
lineA = 0
stShown = 9
IF barindex >= offBars THEN
   shown = aChop[offBars]
   stShown = chopSt[offBars]
   IF almaOk[offBars] = 1 AND almaOk[offBars + 1] = 1 THEN
      lineA = 255
   ENDIF
ENDIF
// Single gold line, or coloured by zone: green / red Trend, orange Sideways
lineR = 176
lineG = 110
lineB = 0
IF colorLine = 1 THEN
   IF stShown = 1 THEN
      lineR = 22
      lineG = 163
      lineB = 74
   ELSIF stShown = -1 THEN
      lineR = 242
      lineG = 54
      lineB = 69
   ELSIF stShown = 0 THEN
      lineR = 234
      lineG = 88
      lineB = 12
   ENDIF
ENDIF

COLORBETWEEN(upperBand, lowerBand, 33, 150, 243, 25)

//=== LABELS (within the last 500 bars with a value) ===
IF labelMode >= 1 AND islastbarupdate THEN
   // Pass 1: find the 500 most recent bars with a value and their range
   vMax = upperBand
   vMin = lowerBand
   nLab = 0
   jEnd = 0
   jB = 0
   WHILE 500 > nLab AND barindex >= jB DO
      IF almaOk[jB] = 1 THEN
         nLab = nLab + 1
         vMax = max(vMax, aChop[jB])
         vMin = min(vMin, aChop[jB])
         jEnd = jB
      ENDIF
      jB = jB + 1
   WEND
   // Pass 2: "Trend" under the line above 61.8, above it below 38.2,
   // "Sideways" on the line in between. Mode 1 labels only the first
   // bar of each Trend zone; mode 2 labels every bar.
   lblGap = (vMax - vMin) * 0.06
   IF nLab > 0 THEN
      FOR jB = 0 TO jEnd DO
         sL = chopSt[jB]
         drawIt = 0
         IF labelMode >= 2 THEN
            IF 9 > sL THEN
               drawIt = 1
            ENDIF
         ELSIF abs(sL) = 1 THEN
            IF abs(sL - chopSt[jB + 1]) > 0 THEN
               drawIt = 1
            ENDIF
         ENDIF
         IF drawIt = 1 THEN
            vL = aChop[jB]
            IF sL = 1 THEN
               DRAWTEXT("Trend", barindex - jB, vL - lblGap) COLOURED(22, 163, 74)
            ELSIF sL = -1 THEN
               DRAWTEXT("Trend", barindex - jB, vL + lblGap) COLOURED(242, 54, 69)
            ELSE
               DRAWTEXT("Sideways", barindex - jB, vL) COLOURED(234, 88, 12)
            ENDIF
         ENDIF
      NEXT
   ENDIF
ENDIF

RETURN shown COLOURED(lineR, lineG, lineB, lineA) STYLE(line, 1) AS "CHOP", upperBand COLOURED(120, 123, 134) STYLE(dottedline2, 1) AS "Upper Band", 50 COLOURED(120, 123, 134, 127) STYLE(line, 1) AS "Middle Band", lowerBand COLOURED(120, 123, 134) STYLE(dottedline2, 1) AS "Lower Band"
Conclusion
The Adaptive Choppiness Index keeps the simple idea of the Choppiness Index, path against net distance, and lets the market choose the window through its dominant cycle. It works best as a regime filter next to a price-based signal, with the Cycle Participation as the one dial that sets how fast it reacts.