 DRAWRECTANGLE
Draw a rectangle on chart with 2 set of x,y coordinates.
Syntax:
|
1 |
DRAWRECTANGLE(x1,y1,x2,y2) COLOURED(R,V,B,a) |
Coloured is optional.
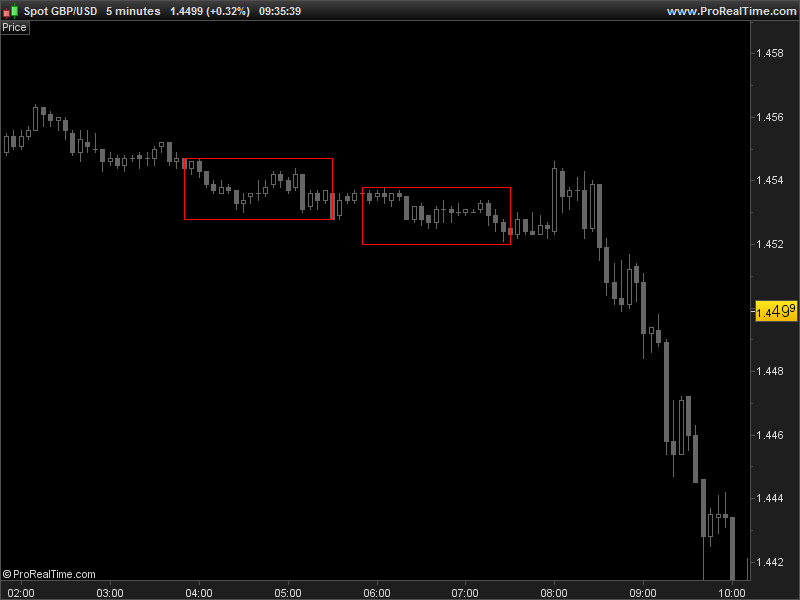
Example 1:
Draw rectangle if difference of last higher high of lower low are not superior than “boxheight”. Draw only if time elapse are no less than “period”.
|
1 2 3 4 5 6 7 8 9 10 11 12 13 14 15 16 17 18 19 20 |
period = 20 boxheight = 20 hh = highest[period](high) ll = lowest[period](low) if hh-ll <= boxheight*pointsize then for i = 0 to period do if high[i]=hh then x2 = barindex[i] endif if low[i]=ll then x1 = barindex[i] endif next if ABS(x2-x1) >= period then DRAWRECTANGLE(x1,ll,x2,hh)coloured(255,10,10) endif endif RETURN |
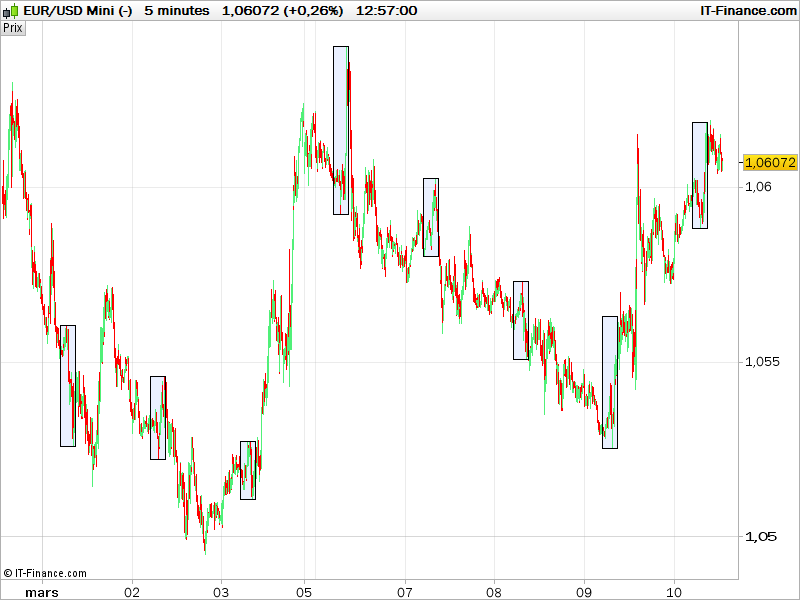
Example 2:
Draw a range box between 2 schedules:
|
1 2 3 4 5 6 7 8 9 10 11 12 13 14 15 16 17 18 19 20 21 22 23 24 25 26 27 28 29 30 31 32 |
starttime = 050000 endtime = 090000 if intradaybarindex=0 then hh = 0 ll = 0 alreadydrawn = 0 endif if time=starttime then startbar=barindex endif if time=endtime then endbar=barindex endif if time>=starttime and time<=endtime then if high>hh then hh = high endif if low<ll or ll=0 then ll = low endif endif if time>endtime and alreadydrawn=0 then drawrectangle(startbar,hh,endbar,ll) alreadydrawn=1 endif RETURN |
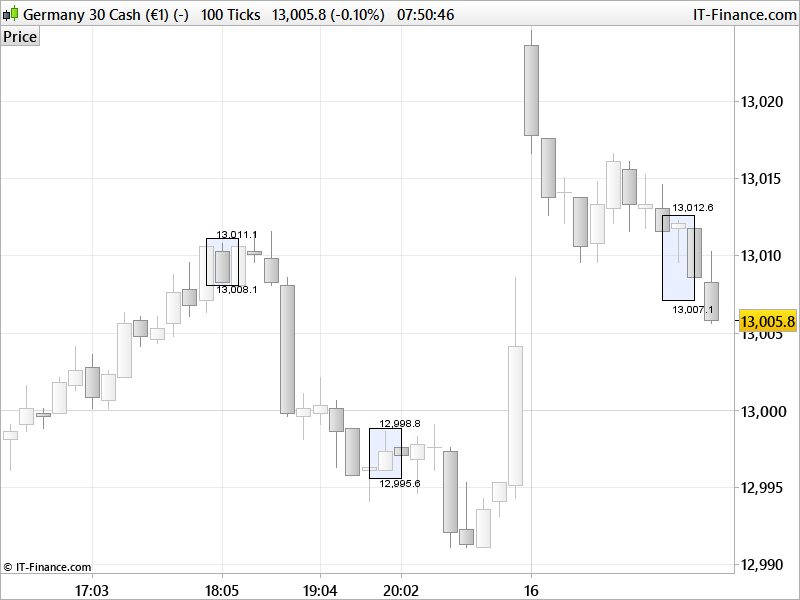
Example 3:
Create a box to highlight an Harami pattern on chart:
|
1 2 3 4 5 6 7 8 9 10 11 |
pattern = high>high[1] and low<low[1] if pattern then drawrectangle(barindex[2],high[0],barindex[0],low[0]) hh = high ll = low drawtext("#hh#",barindex,high+range/10) drawtext("#ll#",barindex,low-range/10) endif return |
Bonjour,
Est-il possible de modifier la couleur intérieur du rectangle?
Merci d’avance pour votre réponse!
Possible uniquement à partir de la version 11 en ajoutant Coloured.
Hi Nicolas. In Ex2 the rectangle looks colored using v10 but in v11 its only the border visible. Trying to figure out how to color the inside as adding “coloured” only changed the border color…
BORDERCOLOR must be added so that COLOURED can be modified in v11. See this example: https://www.prorealcode.com/topic/array-variables-availability-in-prorealtime/#post-118817
c’est bizarre ils ont modifié quelque chose ??? Je n’arrive qu’à colorer le contour avec le paramètre coloured….( version 11.1 du 29 avril…)
Drawrectangle(StartTRX,StartTRY,EndTRX,EndTRY) coloured (100,100,100,100)
il faut ajouter BORDERCOLOR pour que COLOURED soit modifiable en v11. Voir cet exemple: https://www.prorealcode.com/topic/array-variables-availability-in-prorealtime/#post-118817
The first example doesn’t display anything with PRT 10.3. All the other examples work. Can someone help? I tried using the same values: GBP/USD 5min
I changed the first example code to be perfectly compatible with all brokers. Please retry.
Thanks Nicolas!
Bonjour
Pardon je n’ai pas trouvé la réponse à cette question, peut on faire un rectangle fixe en bas à droite (par exemple) de l’écran ? je ne comprends pas comment récupérer les coordonnées, et juste si c’est faisable ?
Non pas encore, mais on pourra très bientôt utiliser des coordonnées en pixels avec des points d’ancrage sur les bords des graphiques.