Traders,
I have been working on the Trend Chaser concept for some time but always had a problem with false signals, large draw-downs, and sub-optimal stops. It had value in that it averages 50% wins on most instruments with most time-frames, so I felt it was worth persevering.
I am indebted to cfta’s idea for grid-step trading and Nicolas’ assistance and development of the code for a brilliant money-management system, as well a number of traders (and my close friend Free2Trade) for their encouragement and ideas. I have been able to find a solution to these problems through the incorporate the money management code with the Trend Chaser code.
It is early days in the testing but so far the results have been spectacular. I have attached a spreadsheet of the test results I have run on major indices, with the optimisation of some of the money management parameters: standard deviation (line 73), risk/reward (line 11) and risk percent (line 9). Please note that the formula in the spreadsheet are:
- ME (mathematical expectancy) = % of winning trades x average gain of winning trades / average loss of losing trades – (1 – % of winning trades).
- IRR (internal rate of return or compounded return per annum) = 360 x (((end $ / start $) ^ (1 / (end date – start date)) – 1)).
- This is a way to compare trading systems with different time frames, starting accounts, outcomes, etc.
- I have rejected ME’s < 0.5, and % wins < 50%.
- The max. DD (max. draw down) is expressed in $’s but the percentage is the dollar amount divided by 100.
- I have noticed that the max draw-down figures given by PRT don’t seem to bear any relationship to the reality of the charts. Does anyone know how this is calculated?
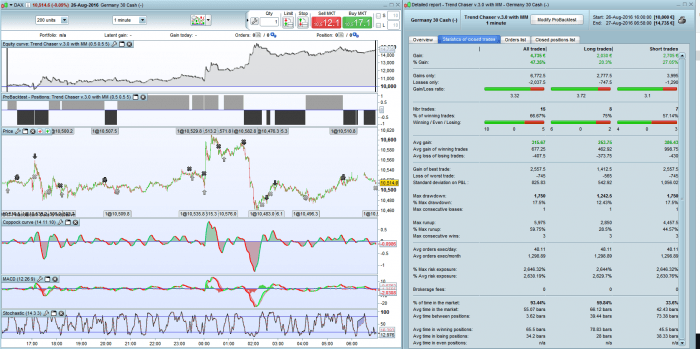
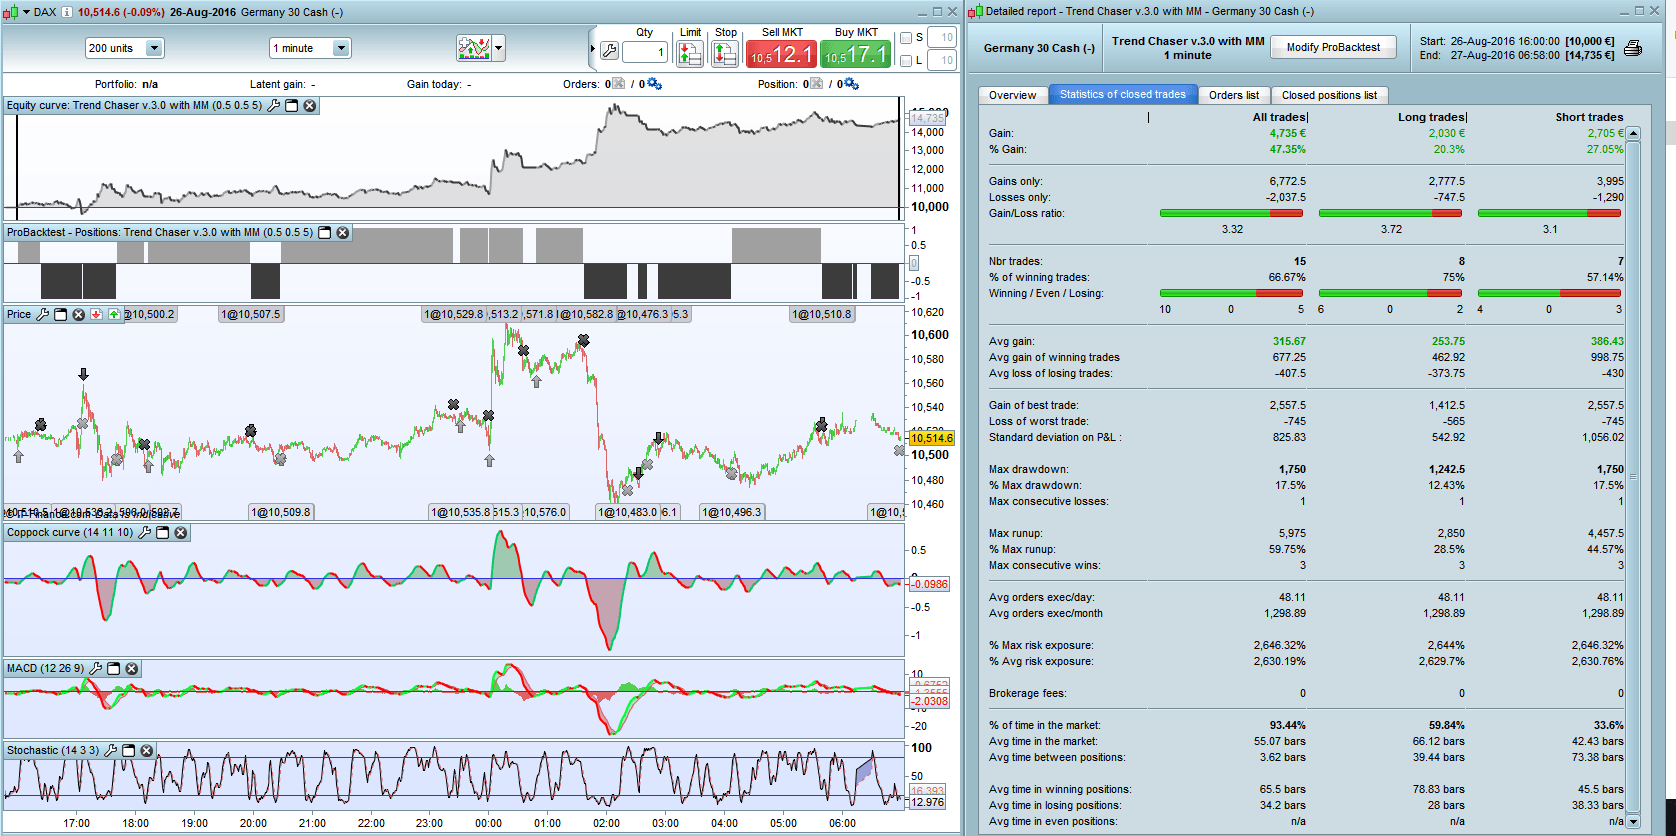
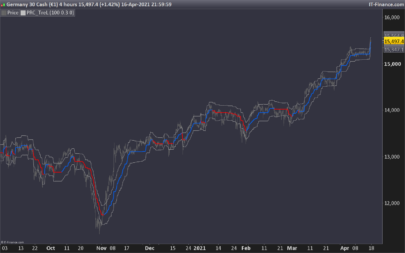
I find that the sweet spot for the code is in the shorter time frames such as 5 and 1 minute charts. The last two tests of the DAX were spectacular as I ran them over only the opening hours for that market. The negatives were the draw-downs of 11% and 17% – worth the risk, Elsborgtrading????
I have attached the code for examination and critique, please. All comments and suggestions for improvement are most welcome.
|
1 2 3 4 5 6 7 8 9 10 11 12 13 14 15 16 17 18 19 20 21 22 23 24 25 26 27 28 29 30 31 32 33 34 35 36 37 38 39 40 41 42 43 44 45 46 47 48 49 50 51 52 53 54 55 56 57 58 59 60 61 62 63 64 65 66 67 68 69 70 71 72 73 74 75 76 77 78 79 80 81 82 83 84 85 86 87 88 89 90 91 92 93 94 95 96 97 98 99 100 101 102 103 104 105 106 107 |
/// Definition of code parameters defparam preloadbars = 3000 DEFPARAM CumulateOrders = false // Cumulating positions deactivated COI= WEIGHTEDAVERAGE[14](ROC[11] +ROC[10]) MAC= MACDline[12,26,9] STO = Stochastic[14,5] once RRreached = 0 accountbalance = 10000 //account balance in money at strategy start riskpercent = rp //whole account risk in percent% amount = 1 //lot amount to open each trade rr = rr //risk reward ratio (set to 0 disable this function) //dynamic step grid minSTEP = 5 //minimal step of the grid maxSTEP = 20 //maximal step of the grid ATRcurrentPeriod = 5 //recent volatility 'instant' period ATRhistoPeriod = 100 //historical volatility period ATR = averagetruerange[ATRcurrentPeriod] histoATR= highest[ATRhistoPeriod](ATR) resultMAX = MAX(minSTEP*pipsize,histoATR - ATR) resultMIN = MIN(resultMAX,maxSTEP*pipsize) gridstep = (resultMIN) // Conditions to enter long positions c1 = (COI > COI[1]) c2 = (MAC > MAC[1]) c3 = (STO > 20) c4 = (STO < 40) c5 = (STO > STO[1]) // Conditions to enter short positions c11 = (COI< COI[1]) c12 = (MAC< MAC[1]) c13 = (STO < 80) c14 = (STO > 60) c15 = (STO < STO[1]) //first trade whatever condition if NOT ONMARKET AND HIGHEST[5](c1)=1 AND HIGHEST[5](c2)=1 AND HIGHEST[5](c3)=1 AND HIGHEST[5](c4)=1 AND HIGHEST[5](c5)=1 then //close>close[1] BUY amount LOT AT MARKET endif if NOT ONMARKET AND HIGHEST[5](c11)=1 AND HIGHEST[5](c12)=1 AND HIGHEST[5](c13)=1 AND HIGHEST[5](c14)=1 AND HIGHEST[5](c15)=1 then //close<close[1] SELLSHORT amount LOT AT MARKET endif // case BUY - add orders on the same trend if longonmarket and close-tradeprice(1)>=gridstep*pipsize then BUY amount LOT AT MARKET endif // case SELL - add orders on the same trend if shortonmarket and tradeprice(1)-close>=gridstep*pipsize then SELLSHORT amount LOT AT MARKET endif //money management liveaccountbalance = accountbalance+strategyprofit moneyrisk = (liveaccountbalance*(riskpercent/100)) if onmarket then onepointvaluebasket = pointvalue*countofposition mindistancetoclose =(moneyrisk/onepointvaluebasket)*pipsize endif //floating profit floatingprofit = (((close-positionprice)*pointvalue)*countofposition)/pipsize //actual trade gains MAfloatingprofit = average[20](floatingprofit) BBfloatingprofit = MAfloatingprofit - std[20](MAfloatingprofit)*sd //floating profit risk reward check if rr>0 and floatingprofit>moneyrisk*rr then RRreached=1 endif //GRAPH floatingprofit as "float" //GRAPH RRreached as "rr" //GRAPH floatingprofit as "floating profit" //GRAPH BBfloatingprofit as "BB Floating Profit" //GRAPH positionprice-mindistancetoclose //GRAPH moneyrisk //GRAPH onepointvaluebasket //GRAPH gridstep //stoploss trigger when risk reward ratio is not met already if onmarket and RRreached=0 then SELL AT positionprice-mindistancetoclose STOP EXITSHORT AT positionprice-mindistancetoclose STOP endif //stoploss trigger when risk reward ratio has been reached if onmarket and RRreached=1 then if floatingprofit crosses under BBfloatingprofit then SELL AT MARKET EXITSHORT AT MARKET endif endif //resetting the risk reward reached variable if not onmarket then RRreached = 0 endif |
Share this
No information on this site is investment advice or a solicitation to buy or sell any financial instrument. Past performance is not indicative of future results. Trading may expose you to risk of loss greater than your deposits and is only suitable for experienced investors who have sufficient financial means to bear such risk.
ProRealTime ITF files and other attachments :
Find other exclusive trading pro-tools on ![]()
PRC is also on YouTube, subscribe to our channel for exclusive content and tutorials
Thanks for sharing your strategy and code.
A sd parameter is missing :
Could you detail it?
Regards
//actual trade gains
MAfloatingprofit = average[20](floatingprofit)
BBfloatingprofit = MAfloatingprofit - std[20](MAfloatingprofit)*sd
Congratulation for this piece of code; I follow your work since few weeks now (Screeners…) and really like the way you work on his system. This is a great surprise to see the results on Dax as it is one of the tool I like to trade. I’ll be glad to test the code and see you can improve it this week. Now it is family time for me… i did run it once on dax. Could you just confirm your answer abou the “sd” parameter ?And maybe just copy and past the entire code with parameters used on the DAX M1. Would be great.As i trade Dax with some other indicators maybe i can help to improve.Regards.
Hi..
I see in the spreadsheet you have tested 1 day on the dax 1 min. Have you checked for sevral days?
HELLO MIKE GC
A parameter is missing ; SD
THANK YOU
Hi Guys,
As BBfloatingprofit is the bollinger band of floatingprofit, you can put 1 to 3 to the SD parameter (2 as usual for BBBand)
I thing there is an error in your code, no:
MAfloatingprofit = average[20](floatingprofit)
BBfloatingprofit = MAfloatingprofit - std[20](MAfloatingprofit)*sdIt isn\'t
MAfloatingprofit = average[20](floatingprofit)
BBfloatingprofit = MAfloatingprofit - std[20](floatingprofit)*sdno ?
Gentlemen, many thanks for your comments.
The code I posted contains three variables for optimisation, as I have found these to be critical to the performance of the code. It seems that you have all got the rr and rp sorted out, but the sd is causing some concern. As zilliq points out, the sd is the standard deviation multiplier of the Bollinger Band stop used when the risk/reward ratio has been reached. The usual BB standard deviation is 2 but the tests I have run produced a number of different results for this critical variable. These results are listed in the Excel spreadsheet attached to the post.
You can run the code as is, with the variables set up, or you can use the ones in the spreadsheet by entering them directly into the code and deleting them from the variables box. I usually set them up in the box as follows:
sd: minimum 0.5, maximum 5, step 0.5
rr: minimum 0.5, maximum 10, step 0.5
rp: minimum 0.5, maximum 10, step 0.5
If you use my settings, you should run them over the same time period I have used. Please note that the closing time for the market will differ depending on your location. My times are for Sydney, Australia, where it is 7:00 am when the DAX closes.
The spreadsheet shows the results of 13 tests on various indices, over varying periods, from one day to 25 days. The longer time periods produce weaker results, but my preference is to find the sweet spot for a particular index or forex pair and then set up the optimised variables for running forward in ProOrder demo mode. The ideal would probably be to do it daily, using the results from yesterday to run it automatically for the next day, trading hours only.
For me, the sweet spot is > 50% win ratio, > 0.5 ME, and <10% draw-down.
I trust this helps. Please let me know if you have any further queries/ideas.
Can anyone advise, please, how PRT calculates the maximum drawdown. I have run tests with significant dips in the equity curve, and yet the detailed report shows 0% drawdown.
Some of the tests I have run on this system are producing drawdowns as high as 70%. If we know the way it is calculated, perhaps we could code a money management stop that would cease trading if the real drawdown exceeded say 10% of the account balance.
I wonder about its relevance or even its reality.
Apologies for the previous double posting – I found a small error in the first post and thought that it would be corrected with the second – oops!
Hi Mike
In reply to your question …
I have run tests with significant dips in the equity curve, and yet the detailed report shows 0% drawdown.
I have noted over the last several months (it used to work okay) that the Drawdown figure on the ‘Detailed Report’ does not get any entries / 0 and then on rare occasions there is an entry (weird?). The lack of an entry / o is not because there is 0 drawdown.
Hope that helps, if indeed I have understood your issue re ‘0 drawdown’?
Cheers
GraHal
Thank you for posting this. Liked your screener from the beginning, even if I do not use it currently. Let’s see how this code will work. Great job and at least +100 lines of derived code, which could mean that there is sufficient logic in it. Unfortunately you have to forward test the variables on dem, as backtesting here is of real use, giving a lot of unrealistic results. Thank you again.
hello mikegc
I have tested your code in the past with the DAX 5 MN and unfortunately i don’t have
good result.it loses money
thank you
regards
In your strategy it seems that all your trades are done within just one day, correct? When I test the system it starts 28 april 2016…. Therefore, my best parameters are SD=2, RP=4.5 and RR=0.5. It gives 56% gain from 28 april, everyone is a gain. But I would really see that kind of resultst on daily basis 🙂
H Framul,
I hope I have answered your questions with my previous comments. If you want to test the system, then follow my notes addressed to DerPat and larouedegann.
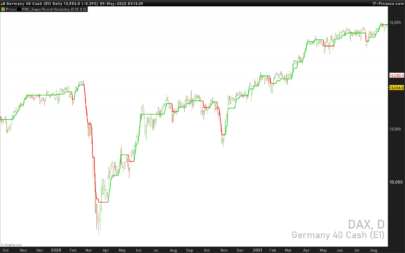
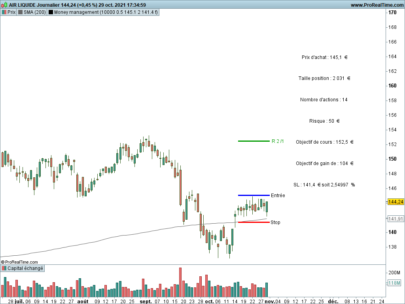
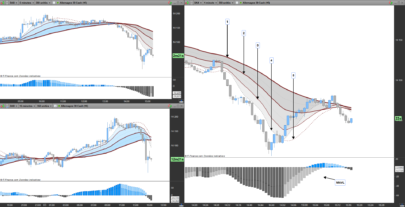
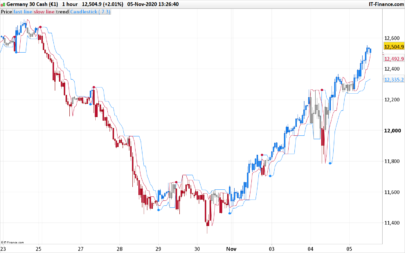
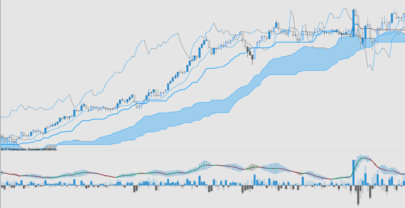
The image is above titled trend-chaser-v-3-0-mm-dax-m1-160828.png and the code as trend-chaser-v-3-0-with-mm.itf.
Happy trading all.
DerPat, thanks for your input. The purpose of the short backtests is to find the optimal parameters for the forward tests. My idea is that the short backtest parameters have the highest probability of being close to the best for the following day. By advancing day by day with new parameters, it will hopefully evolve into a profitable trading system.
Larouedegann, thanks for your note. I have run lots of tests with the DAX that have lost money. It is a case of finding the best combination of instrument, time frame, period of the test. As I mentioned to DerPat, I think the parameters optimised over day 1, are most likely to be good for day 2. Try running the DAX on the 1 minute chart with these parameters: sd=0.25, rr=1.0, rp=4.5, cumulateorders=false, start 25/8/16 on the DAX open and end on the DAX close, spread 2 points. Please let me know the result.
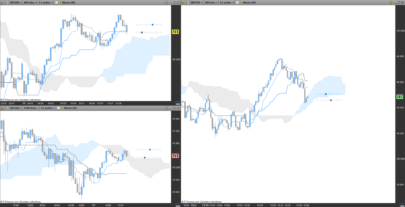
You should get the same result as the attached image of my result. I have also attached a slightly revised code which you will need to import and change the code by entering the above parameters.
Hi Mike, I can see that you have put a lot of work in to this but I can’t seem to emulate your results. You are definitely thinking outside the box with optimising/backtesting the previous day to use on the current day.
https://postimg.org/image/4y66l53ox/
https://postimg.org/image/yeqe1azg1/
Hi Cosmic1, I see you are in Australia and looking for more sleep, like me.
The difference with your test is the Australian opening and closing times of the DAX, which I estimated at 16:00 and 7:00 the next day respectively by looking at where the volumes are on the 1 minute chart. The DAX actually trades from 8:00 to 20:00 in Frankfurt, that translates to 16:00 to 4:00 in Canberra. The chart shows high activity till the NY close at 7:00 in Canberra. Anyway, set your opening and closing times for trade at 16:00 on the 25/8 to 7:00 on the 26/8 and your results should agree. Let me know how you go.
Sleep well!
Hi Mike,
Thanks for your contribution to ProRealCode.
The dynamic grid step doesn’t seem to be working for me. The only way that I could achieve similar results to your DAX 1min is by increasing the starting lot size to 30 with 10k account balance, 4RP, 0.5RR, and 0.5SD.
This is what it looks like for me.
http://imgur.com/PuB8Lh6
Cheers!
Hi siaoman,
There are a couple of reasons why you can’t replicate my results. Firstly, you are running the mini DAX whereas my test was run on the full contract. Secondly you have the wrong times for the start and the end, if you are in Australia. If you correct these, and reset the parameters as outlined above, you should get the same result. Let me know how you go.
However, you can’t complain about your result – it is an excellent outcome. The next step is to optimise the parameters for the mini over the time frame you want to test, and try the same over a few different instruments, until you find the best few to forward test on the demo ProOrder.
Good luck!
Hey Mike,
Cheers for the response.
I live in Perth, so the timeframe for me is 1400 – 0500 for the DAX session.
I’ve just tested it with Germany 30 Cash and 2 lots over 25th Aug to 26th Aug, the results aren’t the same still.
I’m not complaining about the results :p. It’s just the dynamic grid isn’t being built up like how it should be? Do each of your trades remain at the same number of contracts?
Cheers!
I forgot to attach my image to my above message: http://imgur.com/a/2D2lf
Hi siaoman, I’m not sure why you want to replicate my results, but the solution to this problem is not going to take us anywhere, except maybe to prove to you that the code works. Much better for you to test it over a number of indices and FX pairs until you get excellent results, and then try to replicate those results forward in PrtoOrder, which is what I am doing.
The reason the dynamic grid is not building up is because I have found that it doesn’t work that well with indices and works excellently with FX. So with indices I use cumulateorders = false and with FX cumulateorders=true.
I can simulate the identical Backtest to 100% in DAX 30, incredible Results!
Nnow i have add
defparam FLATBEFORE = 080000
defparam FLATAFTER = 230000
and tested the complete month August and get very bad results, only 18€ left…
Hi Tobias, Thanks for your post. I am encouraged that you were able to replicate it.
Also many thanks for your code as I was wondering how to have the code trade solely during market hours for indices.
As for your bad result for the whole month, I am not sure of the advantage of testing code over that length of time, unless you were wanting to run it for the same length of time. It may be that some modification to the code will be more productive but my feeling is that market conditions change so frequently that it may be too much to expect from highly optimised code. I am not sure of the answer, but there may be others who are running ProOrder live over long periods with some success. Perhaps they would care to share their story.
There is a solution, if knew how to code it. It would be to have the trading pause at a certain draw-down level in the account balance. There have been a number of suggestions under the search “drawdown” on this forum, which I am currently testing. But the trade-off is probably reduced profitability. If I acieve some success I’ll post it for critique.
Hi Mike, sorry my flag was wrong. I’m UK based and official trading hours are 8am – 16:30pm. Your trading hours are 15 hours long, right? I have set to 6am – 21:00 (DOW Close) but results are still not the same.
https://postimg.org/image/rf2ox1njh/
Hi Cosmic, if you are on summer time your hours seem correct. But I have no idea why you can’t replicate my results. It could be differences in the candles in IG Markets depending on the time zones, different spreads, etc. In fact, I have seen differences in Australia with the candles, same charts but on different computers. I guess this is ‘Market Makers Privilege”. I you want to conduct an experiment, we could get together on Skype and compare charts. Just give me a time that suits you.
Hi,
More you optimize your variables better are the results but it isn’t the real life !
And there are different errors in the code (I speak of another some posts before). For example
c1 = (COI > COI[1])
c2 = (MAC > MAC[1])
c3 = (STO > 20)
c4 = (STO < 40)
c5 = (STO > STO[1])
if NOT ONMARKET AND HIGHEST[5](c1)=1 AND HIGHEST[5](c2)=1 AND HIGHEST[5](c3)=1 AND HIGHEST[5](c4)=1 AND HIGHEST[5](c5)=1 then //close>close[1]
The conditions are not good !In the first line there are different oscillators and in your conditions line, you seek to obtain 1 (who is impossible or very rare)You better write If STO<20 for example) thenc1=1elsec1=0endifYour code can’t work like that. But thanks for your workZilliqZilliq
Hi zilliq, thank you for your valuable comments. I will test your idea to see if I get better entries. What I am trying to achieve is a long entry, for example, when the low of the COI is higher than the previous low and below zero. The reverse for a short: the high of COI is lower then the previous high and above zero.
Hi Mike,
It’s just that it is 2 different things
In the firest part you test if MACD is going up, and in the conditions you seek when it is equal to 1.
It can’t work like that
Have a nice day
Hi zilliq, doesn’t the “=1” mean that it is true? In other words, it is going up and it is at its highest of the last 5 bars? If not, how should I code it? I am trying to achieve a long position when the COI, MACD and the STO are all rising and the last COI high is lower than the previous high.
No, it doesnt’ work like that, sorry
Replace your line with
if NOT ONMARKET AND c1 AND c2 AND c3 AND c4 AND c5 thenis more that you want toAnd if you want to COI high is lower than the previous highThan you should replace
c1 = (COI > COI[1])by
c1 = (COI < COI[1])
Have a nice day
@Nicolas
Can you do something to edit our messages because actually we can’t and we need to write another or let like this even if we don’t want to
Thanks
I get SD and RP error
What do i need to do and where exact?
Hi Robert, please read back in this post. I have detailed the procedure for setting up the variables for optimisation. If you still have problems let me know.
Hello,
DAX 1 min : very good 😉 (but 70,36% on the market…)
once sd = 2.5 // minimum 0.5, maximum 5, step 0.5once rr = 1.0 // minimum 0.5, maximum 10, step 0.5once rp = 3.0 // minimum 0.5, maximum 10, step 0.5
Spread 1 :
Toutes les positions
Positions longues
Positions courtes
Gain :
3 249,20 €
1 779 €
1 470,20 €
% Gain :
32,49%
17,79%
14,70%
Gain brut :
3874,6
2087,9
1786,7
Perte brute :
-625,4
-308,9
-316,5
Ratio Gains/Pertes :
6,195
6,759
5,645
null
Nb de positions :
14
7
7
% de positions gagnantes :
85,71%
85,71%
85,71%
Gagnants/Neutres/Perdants :
null
Gain moyen :
232,09
254,14
210,03
Gains moyen des positions gagnantes :
322,88
347,98
297,78
Perte moyenne des positions perdantes :
-312,7
-308,9
-316,5
Plus gros gain sur une position :
436,4
391,6
436,4
Plus grosse perte sur une position :
-316,5
-308,9
-316,5
Ecart type gains & pertes :
234,31
234,13
232,41
null
null
null
null
Drawdown max :
544,4
504,3
544,4
% Drawdown max :
5,44%
5,04%
5,44%
Nb max pertes consécutives :
1
1
1
null
null
null
null
Runup max :
3474,1
2253,2
1712,1
% Runup max :
34,74%
22,53%
17,12%
Nb max gains consécutifs :
9
6
5
Moy ordres exec/jour :
0,41
0,41
0,41
Moy ordres exec/mois
9,06
9,06
9,06
null
null
null
null
% Exposition Max au risque :
104,51%
104,50%
104,51%
% Exposition Moy au risque :
98,85%
97,55%
100,33%
null
null
null
null
Frais de courtage :
0
0
0
% temps dans le marché :
70,36%
50,72%
19,65%
Durée moy des positions :
4073,71 barres
5872,43 barres
2275 barres
Durée moy entre 2 positions :
1601,33 barres
4993,12 barres
8140,88 barres
null
null
null
null
Durée moy positions gagnantes :
4532,17 barres
6543,33 barres
2521 barres
Durée moy positions perdantes :
1323 barres
1847 barres
799 barres
Durée moy positions neutres :
n/d
n/d
n/d
Alocin, an excellent result. What hours did you run this test?
MikeGC : France (00:00 00:00)
Agree with Zilliq, the portion of the code is wrong.
if NOT ONMARKET AND HIGHEST[5](c1)=1 AND HIGHEST[5](c2)=1 AND HIGHEST[5](c3)=1 AND HIGHEST[5](c4)=1 AND HIGHEST[5](c5)=1 then….
Not exactly sure what testing logic you want but just to give you an coding idea.
c1 = COI > Highest[5] (COI)c2 = MAC > Highest [5] (MAC)c3 = STO > 20c4 = STO < 40c5 = STO > Highest[5] (STO)
if not onmarket and c1 and c2 and c3 and c4 and c5 then…….
Many thanks, sylvess and Zilliq, for your suggestions. What I am trying to achieve is to enter long when the COI < 0 and has achieved a higher low. Is this possible?
How often do you guys optimize the sd, rp and rr?
I use DAX EUR 1 mini contract, and not cash. Time in market is 99,8%. I’m in the market all the time. Is this some kind of weakness to the system? Will it be the same if I use cash contracts?
Hi Framul,
There is some contention about the code. Please don’t use this on a live account. I have found in testing the the original code as posted, works better than the suggested corrections. The difference between the mini and the cash is probably a factor of 10. Thus you will get better money outcomes with the cash contracts.
Re optimisation, because of the volatility in the markets, it is better to optimise more frequently, even daily. I also have added in the opening and closing hour of the instrument being traded, which is essential in the shorter time frames as the “out of hours” trading has lots of gaps. Thus add into the code:
DEFPARAM FlatBefore = (opening time of the market in “123456′ format eg 090000)
DEFPARAM FlatAfter = (closing time of the market)
I would be interested to see some of your test results.
Hi MikeGC,
I have changed my nickname. Thanks for replay to my question.
When I added your time-code to the strategy model I got an error (code is invalid). I’m not that pro in programming:)
I have been ussing the model for a week. I had som bad trades on Friday, but in sum the model gave net profit for the week. I use the model in 30 sec graphs, and not in 1 minute. In 30 sec graphs I believe the drawdown is smaller. But when I backtest I only have 1 week history. That’s a risk.
I agree to your advice to do optimisation on a daily basis. When you do backtest, do you use long historic, only the last day, or….?
The system will not run anymore. I get the following message from IG:
This trading system was stopped because the program used a negative or zero offset (ex: close[-10]) during the evaluation of the last candlestick. Please add protections to your code to prevent negative or zero offsets.
What do I have to change in the code?
@GraHal, I have also noticed zero draw downs on occasions which seems odd. Do you know how the DD is calculated? If it is from the difference between the high and the low of the biggest drop, it still doesn’t compute. My suggestion is to optimise with the minimum negative equity curve below zero.
Have you had any success with the system? I am finding that the MGC Trend Chaser works better in the longer time frames and am now testing some in ProOrder demo mode.
/// Definition of code parameters
DEFPARAM CumulateOrders = false // Cumulating positions deactivated
COI= CALL \"MGC-Coppock\"[14, 11, 10](close)
MAC= MACDline[12,26,9](close)
STO = Stochastic[14,5](close)
ST = supertrend[a,b]
// Conditions to enter long positions
c1 = (COI > COI[1])
c2 = (MAC > MAC[1])
c3 = (STO > 20)
c4 = (STO < 40)
c5 = (STO > STO[1])
IF HIGHEST[5](c1)=1 AND HIGHEST[5](c2)=1 AND HIGHEST[5](c3)=1 AND HIGHEST[5](c4)=1 AND HIGHEST[5](c5)=1 AND NOT ONMARKET THEN
BUY 1 CONTRACT AT MARKET
ENDIF
//SET STOP %Trailing 10
// Conditions to exit long positions
//c6 = (COI< COI[1])
//c7 = (MAC< MAC[1])
//c8 = (STO < 80)
//c9 = (STO > 60)
//c10 = (STO < STO[1])
//IF HIGHEST[5](c6)=1 AND HIGHEST[5](c7)=1 AND HIGHEST[5](c8)=1 AND HIGHEST[5](c9)=1 AND HIGHEST[5](c10)=1 THEN
IF Close CROSSES UNDER ST THEN
SELL AT MARKET
ENDIF
// Conditions to enter short positions
c11 = (COI< COI[1])
c12 = (MAC< MAC[1])
c13 = (STO < 80)
c14 = (STO > 60)
c15 = (STO < STO[1])
IF HIGHEST[5](c11)=1 AND HIGHEST[5](c12)=1 AND HIGHEST[5](c13)=1 AND HIGHEST[5](c14)=1 AND HIGHEST[5](c15)=1 AND NOT ONMARKET THEN
SELLSHORT 1 CONTRACT AT MARKET
ENDIF
//SET STOP %Trailing 10
// Conditions to exit short positions
//c16 = (COI> COI[1])
//c17 = (MAC> MAC[1])
//c18 = (STO > 20)
//c19 = (STO < 40)
//c20 = (STO > STO[1])
//IF HIGHEST[5](c16)=1 AND HIGHEST[5](c17)=1 AND HIGHEST[5](c18)=1 AND HIGHEST[5](c19)=1 AND HIGHEST[5](c20)=1 THEN
IF close CROSSES OVER ST THEN
EXITSHORT AT MARKET
ENDIF
Hi @Mike
I get zero Drawdown figure on all my systems / Bots (i.e. not yours / this one) for the last several months except maybe for a very simple Bot (few lines of code and Backtested over a short preiod).
I put the lack of a Drawdown figure down to a cut off limit on the processing / calculating time back at the PRT server. I could be 100% wrong on this and keep meaning to email PRT about the lack of an entry in the Drawdown box. I should mention I am with IG.
Yes I understood Drawdown to be the largest contiguous drop from High to Low on the equity curve and ‘back in the days’ when a Drawdown entry did show … this checked out as valid. However I can’t say I spent a lot of time on it … maybe it was a quick look see and I never analysed it to see that it didnt exactly compute to this logical definition.
Cheers
GraHal
ProOrder results without money management and with SuperTrend exit/stop loss as above.
Syntax error: The function “MGC-Coppock” called from “Trend chaser supertrend” does not exist.
Sorry Frank, substitute COI = WEIGHTEDAVERAGE[14](ROC[11]+ROC[10]) for the MGC-Coppock line.
Please post your other emailed questions to the forum. Thus, if I can’t answer them, someone else might be able to.
Thanks Mike,
When I was about to test it on live account, the following message occured and the model stopped:
This trading system was stopped because the program used a negative or zero offset (ex: close[-10]) during the evaluation of the last candlestick. Please add protections to your code to prevent negative or zero offsets.
Hi Frank,
Same problem as last time. There is some change made to the code that I can’t locate without the code.
“The best solution is to go back to the original code and make one change at a time.”
Hi Mike,
Great stuff, I really like to the code and it seems like a terrific filter for the grid system so feel free to discuss in my thread if you like 🙂
Hi cfta, I have posted to your thread. The combination of the two systems needs a lot more testing, but I am having trouble fully understanding the logic of the code to test the alternatives. Thus the tests I have run purely optimise the the parameters. There is a spreadsheet of the test results on your thread.
Let me know your thoughts.
Hi MikeCG
i’ve problem to start the MGC Trend Chaser in 5min timeframe , because the backtest was really good . But the System gave me always an errormessage for an negative or Zero value for the last candle , i should put somewhere ” close[-10] . Do you know where i have to change the code ?
BR Michael
Hi Michael, please send me the code you are testing and I will track down the problem.
Cheers, Mike
Hi Mike,i use the mgc-trend-chaser-160914.itf exactly, starting thje backtest no problem . But i when start the code forthe real trading on the platform , exactly after 5 min the system isinterupted. With Advice to add some or change the code with ……BRMichael
Hi Mike
Thanks for the work – am relatively new to PRT but wanted to ask in reference to what Zilliq and Sylvess have said about the conditions and your comment that you think the =1 represents ‘true’ (I’ve no idea btw!) I’ve been playing around with the code and running some ProOrders in demo and am getting orders but not sure they’re being best placed so just wanted to ask if you could clarify the conditions/logic you are after please?
I know you’ve said it a few times above but reading and re-reading some contradicts and I am not sure if you are after consecutively rising indicators or new highs/lows plus the COI is a Weighted Moving Average from what I understand so not sure how this could be less than zero (or I have totally misunderstood of course!) but it is not represented in the code (COI < 0) so was hoping to better understand then have a go at coding what you are after in a different way (as per Zilliq and Sylvess comments) if you could perhaps explain please..?
As I say it is generating orders so perhaps the logic as you wanted it is already there and no need to re-code but would be up for having a go if any doubt! 🙂
cheers
Max
Hello @Michael,
My apologies for the delay in responding to your query. When ProOrder rejects code it shows a warning yellow triangle. Hovering the mouse over the triangle will tell you the problem. I need to test the actual code to see the problem and fix it. I may be able to pick the issue with the details of the warning message, but the code would be better.
Hello @MaxT,
The code “HIGHEST[5](c1)=1” is saying look back 5 bars and pick the highest bar that complies with condition c1. Condition c1 is that the Coppock for that bar is higher than the Coppock for the previous bar. If this is true (=1), and all the other conditions are true, then do the following…..
I am looking for a confluence of the 3 indicators and 5 conditions within 5 bars as a signal to buy or sell. If you want to test the efficacy of the code, remove the “HIGHEST” phrase and run the code reading “IF c1 AND c2 AND ……etc”.
There is no requirement in the code for COI<0. COI must be less than COI(1) for a short position. This means that it is sloping down from a high point.
I hope this clarifies your concerns. Let me know if I can be of further assistance.
Cheers,
Mike
Hi Mike
Many thanks starting to make a bit more sense now and also seen the same code used in other strategies on here/understand you are merging ideas etc.
Also wanted to confirm- the 3 .itf’s posted here – the MGC is your supertrend v2.0 using the supertrend indicator for sl/tp and the Trend Chaser v3.0 is the same as the Trend Chaser v3.0 with MM just that you have made the sd parameter more convenient at the top of the code in the MM version?
And the grid ordering only works when cumulate orders are set to true but the money management is what is calculating the sl/tp yeh?
cheers
Max
Hi Mike
I see the HIGHEST[5] condition comes from cfta’s post ‘Grid orders with…’ but he states he doesn’t think he’s quite got it figured out (and I think he/Zilliq/sylvess are right… or rather ‘wrong’ 😉 cannot post there though for some reason)
I created new code using only the MAC and this HIGHEST[5] and it does not enter positions according to last 5 bars continuously rising
Also assuming it did work correctly then it makes sense checking the COI, MAC and STO this way but you are also ‘asking the same’ of conditions c3, c4, c13 and c14 which doesn’t make sense/these conditions are only that the STO is greater than or less than a figure and not continuously rising (unless you are trying to ‘ask’ that they have remained above/below these figures for the last 5 bars?)
Probably not the most elegant way/bit long winded but the attached ‘works’ for continuously rising/falling over last 5 bars (but a trade can be entered then immediately exited the next bar if MAC continues to rise/fall for 6th bar whereas I think the idea would be to ‘reset the clock’ once a position had been entered…? Not sure how to achieve that though…!)
/// Definition of code parameters
DEFPARAM preloadbars = 3000
DEFPARAM CumulateOrders = FALSE // Cumulating positions deactivated
MAC = MACDline[12,26,9]
// Conditions to enter long/exit short
EL1 = (MAC > MAC[1])
EL2 = (MAC[1] > MAC[2])
EL3 = (MAC[2] > MAC[3])
EL4 = (MAC[3] > MAC[4])
EL5 = (MAC[4] > MAC[5])
// Conditions to enter short/exit long
ES1 = (MAC < MAC[1])
ES2 = (MAC[1] < MAC[2])
ES3 = (MAC[2] < MAC[3])
ES4 = (MAC[3] < MAC[4])
ES5 = (MAC[4] < MAC[5])
//Enter long
IF NOT LONGONMARKET AND NOT SHORTONMARKET AND EL1 AND EL2 AND EL3 AND EL4 AND EL5 THEN
BUY 1 LOT AT MARKET
ENDIF
//Enter short
IF NOT LONGONMARKET AND NOT SHORTONMARKET AND ES1 AND ES2 AND ES3 AND ES4 AND ES5 THEN
BUY 1 LOT AT MARKET
ENDIF
//Exit long
IF ONMARKET AND ES1 AND ES2 AND ES3 AND ES4 AND ES5 THEN
SELL AT MARKET
ENDIF
//Exit short
IF ONMARKET AND EL1 AND EL2 AND EL3 AND EL4 AND EL5 THEN
EXITSHORT AT MARKET
ENDIF
Hi Max,
Many thanks for your input.
The 5 bar look-back only checks that the condition was fulfilled in the last 5 bars. Your idea to check that it is continually rising/falling is good, but the entry point is when, during the last 5 bars, there is a change in the indicators. I have found that it is the turning point that is more accurate. How did your tests work out?
And the answer to all your questions from 2 days ago is “yes”.
Let me know how you go.
Aha! I think that was when it was entering in my tests – on a change so I guess it is working as intended! *blush* 🙂
Many thanks all very helpful figuring out how this is working – haven’t run any tests along the way I just posted but have had a few proorders running in demo mode with some good results using your original code so perhaps I will just stick to that! 🙂
cheers
Max
Hi Mike, Thanks for your great code! It is working great on backtests, but I want to test it on demo and it doesn’t work. http://www.prorealcode.com/topic/prepare-for-automatic-trading-error/
?Hi,
what is the latest code for these strategy ? thanks
Hi @Alco, I have responded in your post re trading errors.
Hi @volpiemanuele, the only new code is that which I have optimised. Now a word of warning, most automatic trading systems are quite complex with lots of variables. If you get a spectacular result in back-testing, it does not mean that you will get the same result in ProOrder. You need to forward test in ProOrder in demo mode for some time to be sure the code will produce a satisfactory result when run live. And even then there is no guarantee.
Read @cfta posts for a good strategy for using ProOrder safely. I don’t think it is a “set and forget” opportunity. It really needs supervision unless someone is clever enough to create some self-optimising code.
Thank you Mike, very interesting job, seems quite peculiar with respect to all the strategies I have seen on this forum so far, but maybe Its because I’m just a beginner.
Results looks pretty good though.
Correct me if Im wrong, the idea is to use the Trend Chaser in 1 minute time frame. Turn it on and then take a profit as soon as the trade capture the short term trend, take a profit and re run it.
Is that right?
Correct me if Im wrong, the idea is to use the Trend Chaser in 1 minute time frame. Turn it on and then take a profit as soon as the trade capture the short term trend, take a profit and re run it.
Is that right? Because otherwise from what I see in the recent past in the 1minutes TF it doesnt switch positions
Does anyone have this updated code? or tested in demo?
Hi Mike.
Thanks for sharing the code.
Whit which indexes do you recommend to use it and in which timeframe? Only 1 min or also in other TF?
Thanks
Hi All, apologies for the late response to your queries. I have been away and have not been trading for some months.
I posted the code I have used manually with some success, in the hope that someone might develop it further to the point that it could be run successfully in ProOrder. This has not happened and my trials in PO were not exciting.
My manual operation of this system works about 50 % of the time and depends on manual money management to make a 3:1 reward to risk.
I can’t tell you how best to use a system because everyone has a different style of trading. Take the ideas, play with them and develop your own style that works best for you.
On that note I would like to close this post and will not be following it in the future.
Thank you for all contributions and your interest. May you develop a successful trading system.
What does COI stand for?
Hi Mansoor, COI is the abbreviation for the Coppock indicator.
Anyone interested in this strategy please see forum topic: https://www.prorealcode.com/topic/dow-2h-trend-chaser-v4-mm/