Dear all,
I found this nice strategy by playing with candlestickpatterns with 2 candles.
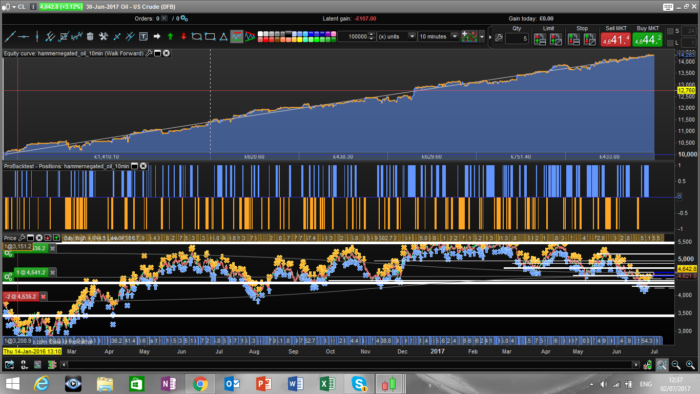
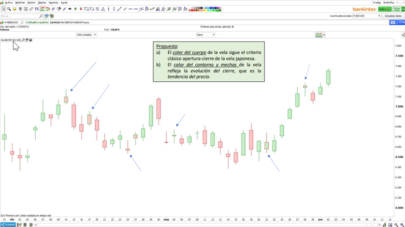
Basically I considered the “hammer negated” pattern, where you have first an hammer candle (body on the upper or lower 25% of the candle) and then a candle which negate the hammer so in case we have a bullish hammer, then we have a candle whose body is within yesterday candle shadow. I hope it is clear as I have no idea how to draw candles on the laptop.
I added then a few moving average that identifies momentum, and opted for trailing stops.
The only thing I have optimized here are trailing stops level. All the moving average period, the parameter that defines the candlestick pattern are not optimized, no target profit either. Thats why WF results are pretty impressive.
Only downside as usual is that I dont have more than 100K history.
Enjoy
Francesco
|
1 2 3 4 5 6 7 8 9 10 11 12 13 14 15 16 17 18 19 20 21 22 23 24 25 26 27 28 29 30 31 32 33 34 35 36 37 38 39 40 41 42 43 44 45 46 47 48 49 50 51 52 53 |
defparam cumulateorders = false av1 = average[5](close) av2 = average[10](close) av3 = average[50](close) x = 0.5 bull = close> av1 and close >av2 and close > av3 bear = close <av1 and close <av2 and close <av3 //n= 1 hammerup = min(open[1],close[1])>high[1]-(high[1]-low[1])/3 //and timeok hammerupnegated= max(open,close)<min(open[1],close[1]) and abs(open-close)/(high-low)>x cs = hammerup and hammerupnegated and bear hammerdown = max(open[1],close[1])<low[1]+(high[1]-low[1])/3 //and timeok hammerdownnegated = min(open,close)>max(open[1],close[1]) and abs(open-close)/(high-low)>x cl = hammerdown and hammerdownnegated and bull if cs then sellshort 1 contract at market endif if cl then buy 1 contract at market endif //TRAILING STOP TGL =18 TGS= 24 if not onmarket then MAXPRICE = 0 MINPRICE = close PREZZOUSCITA = 0 ENDIF if longonmarket then MAXPRICE = MAX(MAXPRICE,close) if MAXPRICE-tradeprice(1)>=TGL*pointsize then PREZZOUSCITA = MAXPRICE-TGL*pointsize ENDIF ENDIF if shortonmarket then MINPRICE = MIN(MINPRICE,close) if tradeprice(1)-MINPRICE>=TGS*pointsize then PREZZOUSCITA = MINPRICE+TGS*pointsize ENDIF ENDIF if onmarket and PREZZOUSCITA>0 then EXITSHORT AT PREZZOUSCITA STOP SELL AT PREZZOUSCITA STOP ENDIF //set target pprofit n*averagetruerange[14] //set stop ploss m*averagetruerange[14] |
Share this
No information on this site is investment advice or a solicitation to buy or sell any financial instrument. Past performance is not indicative of future results. Trading may expose you to risk of loss greater than your deposits and is only suitable for experienced investors who have sufficient financial means to bear such risk.
ProRealTime ITF files and other attachments :
Find other exclusive trading pro-tools on ![]()
PRC is also on YouTube, subscribe to our channel for exclusive content and tutorials


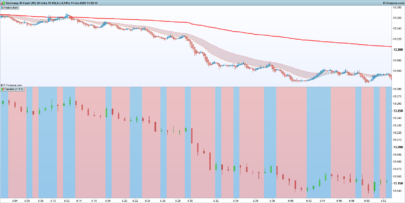

Many thanks for sharing this Francesco. I like the simplicity of it and the fact that long and short positions contribute almost equally to the results makes it more robust in my opinion as it’s more likely to perform consistently in the future. There is no intraday data beyond 01/16 for Oil as far as I am aware (even on the Premium version which has supposedly 200k units) so unfortunately it cannot be tested beyond this.
Interestingly, I get vastly different results between the DFB data in IG and the CFD data in the PRT Premium version which has half the trades as the DFB one. I can’t figure out why, needs some further investigation. I am aware that the two sometimes are different but I’ve never seen differences this big ! Interestingly the 30m backtest in the Premium version produces a very good result.
I can’t attach my results to this post unfortunately as for some reason it says I’m not allowed.
thanks Manel, thats quite worrying then. Is there anyway we could sumbit this problem to prt engineers?
I think its down to the data in the spreadbet vs CFD contracts being different thus leading to different signals being generated. I’ll investigate fully a bit later on to see if it’s the data or the system causing the differences. The CFD backtest includes most of the SB trades so they match, but the SB one just has almost twice the amount for some reason.
Also, just to highlight the backtest should be run with a 3pt spread and not the default 1pt one in the file. It doesn’t make a big difference on the overall results trend which is good:-) , just reduces the total profit figure of course and the draw.
I think in the meantime I will run both on demo in SB and CFD and track the activity. Will report back once I have some results.
Hi – the system took a long position @ 15.40 which has locked in a 20pt profit based on the 18pt trailing stop. Will likely get closed soon I would have thought as it drifts given the US holiday today.
Franceso fyi – I recalibrated the system for the increased spread of 3pts and am using a 20pt long and 55 short trailing stop. Its not the highest return set of variables but it gives a more stable set of returns.
Hi Manel, i have found this same issue, some strategies (but not all) that are written with CFD examples pictured, don’t run as well when tested with a spread betting account. i initially thought this may be due to the time passed, and thus the strategy no longer works. however, when testing the longer term automated strategies (written for daily, weekly time frames) i see that my charts / equity curve does not match that of the CFD documented on these forums. i thought that maybe it was just me but i have seen this spoken about on a few occasions. have you managed to find the reason? do we know if prices differ between spreadbetting accounts and CFD accounts?
Wow. This strategy looks very good. Ill test it my self later on today .
For now I am running my old oil strategy from Last year but seems to be an good idea too test this one out as well.
I really like Nicolas MEF stop so I will see what happens with that compared to your stop.
Thanx for shearing 🙂
I was not able to.make this strategy work on prt trough ig and 100k candels.
It makes profit but not like you made it.
I see that other here also has some.problems.
Nice work !
Hello Francesco, very good strategy! Could you maybe post the code of this strategy as an indicator? 🙂
Hi m-zeter, yes sure you can do that
av1 = average[5](close)
av2 = average[10](close)
av3 = average[50](close)
x = 0.5
bull = close> av1 and close >av2 and close > av3
bear = close <av1 and close <av2 and close <av3
//n= 1
hammerup = min(open[1],close[1])>high[1]–(high[1]–low[1])/3 //and timeok
hammerupnegated= max(open,close)<min(open[1],close[1]) and abs(open–close)/(high–low)>x
cs = hammerup and hammerupnegated and bear
hammerdown = max(open[1],close[1])<low[1]+(high[1]–low[1])/3 //and timeok
hammerdownnegated = min(open,close)>max(open[1],close[1]) and abs(open–close)/(high–low)>x
cl = hammerdown and hammerdownnegated and bull
retrun cl, -cs
this should work
Thanks! That was very helpful 🙂
Best wishes!
Hey!
Thanks for sharing, very nice code!
I only have one question, in the code, for example, on some places in the backtest you exit short trades with a long trade and long with a short. Does this work when you put it on live? Doesen´t a long position have to be closed before a short one opens?
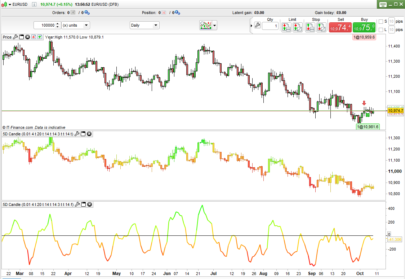
I also wonder why the trailingstop isn´t stopping out the position at november 18 2016 where the equity curve drops from 11305 to 10835 even though ther´s a trailing stop for 24p?
To T-trader: if a signal for lets say short comes afte a long position is taken it can sell the short and go long.
If the buy orders are written line 18 if cs and not onmarket then ……
Line 22 if c1 and not onmarket then…….
It will not take a short over roo long and opesite.
Also sometimes the market can be very volitile and make a slip as we say where the stop is not able to close the trade fast enough so it can happen that the loss is larger then intended. Also the same can happen when target is to be hit were you get more profit than calculated.
Usually this doesent happen to offen:)
Is the code tested in us crude?
I checked the code on brent crude and did not get the same result as shown?
yes on crude oil. Thanks
Thanks Kenneth. Didn´t know that was possible to do in proorder! 🙂
About the trailingstop. The position is open for at least a day and is moving 500p down then up and then down again. Feels very strange that the position isn´t stopped out and that´s worrying me and should worrie others as well…
The system was stopped .motif division by zero impossible on the last candlestick ??
Are you running the strategy live?
Hi Francesco ,
nice work
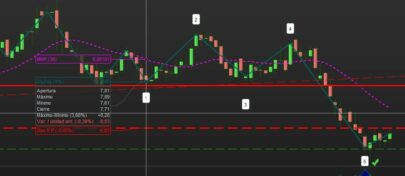
Do you have the best result also in 2016 ?
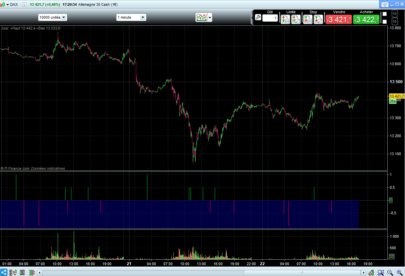
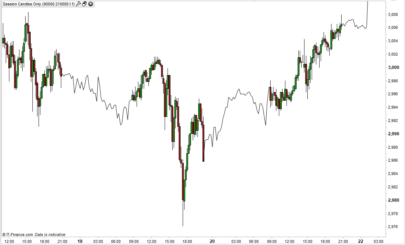
Hi jr, what do you mean? 2016 is showed in the pictures.
Thanks
Hi Francesco ,
Sorry I mean 2015 …. to have more backtest
nice work
yes kenneth, the strategy was in live.once again I start this strategy in live.like that i will be sure there is a mistake somewhere.
Are you running it as code showed above or optimised?
Do you have stop code on?
How many trades have been taken before failure?
Running it on us crude mini contract or original?
Hi Francesco ,
Sorry I mean 2015 …. to have more backtest
nice work
to have a
In french, on which oil contract is this system running ? And, what’s the spread used for the backtest ?I see there’s no hour to start & stop the system, is it normal ?
Quelques questions… sur quel contrat est “pétrole” est testé cette stratégie ? (correspondance sur IG CFD ??)Quel spread doit-on appliquer pour avoir qq chose de réaliste ?Je vois qu’il n’y a pas d’horaire de début/fin … selon le contrat, est-ce normal ?
I don’t see anyone speaking French here.. Do you?!
oui je parle français.. je demande juste qq éclaircissements. Je n’ai pas l’habitude de regarder les contrats pétrole et demande donc sur quel nom de contrat (IG Market France) cette stratégie est sensée tourner ? Quel spread il faut prévoir pour un rendu réaliste ? Et s’il n’est pas souhaitable d’ajouter des horaires de début/fin de la stratégie…
System is shown with us crude and spread is usually 2,8pip. But I think in the strategy and pic. Shown 1 pip spread is used.
And its just as normal to have tradingsystem made with or without trading times/houers. Then it will trade in europe , us and asia time.
About the trailingstop: it is no code for stop in the trailing. It only stops if price goes right way(profit way) then the trailing will start and price retracment over trailing setting will stop/make it sell out.
Best ges to cover tje 500pip drawdown is to make a stopcode togehter with the trailingcode.
Hi Keneth, oil is 1 to 2 pips wide on my ig (uk).
Did you manage to find better results with a standard stop?
Thanks
Hi Francesco.. I dident have enough time yesterday, but later today I will see what results I might get and let all you guys know 🙂
Spread might be diffrent between contries? I have 2,8pip in avrage. People should just check what they have trough there broker.
FRANCESCO: is there a stop code if price directly after taken position goes in minus/not profit will it then exit or does price need to go in.profit before stop or trailing will activate?
I am not a expert in reading codes.
I did put a stop code on 100pip in the system but but code got lot worse then without
the trailing stop activate only after the position is in profit. you can try to use normal stops, buy the equity line gets worst, although not terribly worst.
I liked trailing stops because they improved the work forward analysis
So this means that there is only possabilety for the system to activate a trailingstop and not a stop if price retraces right after buy/sellshort at market. ?
And if it retraces it wont sell in loss at anytime ?thats why are 500pip drawback that got covered was not before price whent up 500+pip again?
Anyway. Supergreat strategy(not tested alot yet) but hope someone can confirm that prt works with no bugs, i have had some issues with some strategies before but I will for sure start it as soon as I have capital from current livetesteing strategy 🙂
Hi Francesco ,
Sorry I mean 2015 …. to have more backtest
nice work
no unfortunately dont have the data. would be great if someone could test it further down in the past
Is there anybody who has more than 200 000+++ candel. I tought 200k candels where maximum with premium prt acc.
larouedegann
It happens to me like “Larouedegann”, somewhere in the code there is an error because I am operating in real and the system stops, it says that it can not follow because there is a division by 0
I think i solved the division-trouble by this:(open-close)/((high-low)*1)>x
hammerupnegated= max(open,close)<min(open[1],close[1]) and abs(open-close)/((high-low)*1)>x
cs = hammerup and hammerupnegated and bear
hammerdown = max(open[1],close[1])<low[1]+(high[1]-low[1])/3 //and timeok
hammerdownnegated = min(open,close)>max(open[1],close[1]) and abs(open-close)/((high-low)*1)>x
It’s strange because I don’t get that error and the system has now taken 2 trades, last one closed this morning for 4pt profit. Wonder why it only occurs for some people.
@ Kenneth, you are right, you cannot get more than 200 candles of history with Premium account
Hi,
I got the same problem in Oil USA 10′. The system was canceled because there is a division by 0. I will try to apply the modification and see what happens.
Thanks,
Juan
P.S.- By the way Francesco, thanks so much for your codes. You are doing a fantastic job.
j’ai relancé le système et effectivement il fonctionne normalement maintenant.Bizarre ?????
Il a meme pris un trade de 4 pips
Hi. Did you get the problem with 0 division fixed?
What Nicolas said…..:-)
Hi everyone: here is diffrences between original code from Francesco78 and the one I have put stop code on and target + optimised.
Could not upload pic sorry. (dont have accsess)
US crude E1 mini 10min chart 100 000tick .
Win:87%
Gain:Alittle better than original and dosent drop 500pip but stop at 110pip.
I dont know how the optimised one will work on live trading but I guess someone with the original one can come with feedback if someone have tested it and I will test the optimised one as soon as I have enough capital too do so/ or someone else can get the code and try 🙂
defparam cumulateorders = false
av1 = average[3](close)av2 = average[20](close)av3 = average[50](close)x = 0.5bull = close> av1 and close >av2 and close > av3bear = close <av1 and close <av2 and close <av3//n= 1
hammerup = min(open[1],close[1])>high[1]-(high[1]-low[1])/3 //and timeokhammerupnegated= max(open,close)<min(open[1],close[1]) and abs(open-close)/(high-low)>xcs = hammerup and hammerupnegated and bearhammerdown = max(open[1],close[1])<low[1]+(high[1]-low[1])/3 //and timeokhammerdownnegated = min(open,close)>max(open[1],close[1]) and abs(open-close)/(high-low)>xcl = hammerdown and hammerdownnegated and bull
if cs thensellshort 2 contract at marketendif
if cl thenbuy 2 contract at marketendif
//TRAILING STOPTGL =30//32TGS= 20//32if not onmarket thenMAXPRICE = 0MINPRICE = closePREZZOUSCITA = 0ENDIFif longonmarket thenMAXPRICE = MAX(MAXPRICE,close)if MAXPRICE-tradeprice(1)>=TGL*pointsize thenPREZZOUSCITA = MAXPRICE-TGL*pointsizeENDIFENDIFif shortonmarket thenMINPRICE = MIN(MINPRICE,close)if tradeprice(1)-MINPRICE>=TGS*pointsize thenPREZZOUSCITA = MINPRICE+TGS*pointsizeENDIFENDIFif onmarket and PREZZOUSCITA>0 thenEXITSHORT AT PREZZOUSCITA STOPSELL AT PREZZOUSCITA STOPENDIF
SET STOP ploss 110////120//120SET TARGET pPROFIT 52//50
thank you Kenneth!
I agree with @Kenneth, did the same optmization with TGL and TGS 30 and 20 respectively and 2 contracts for long and short positions.
Stop ploss 100
Hello everyone,
For those who negotiate Crude EE.UU. 1€ in IG Markets I suggest another optimization, feel free to try it:
//BACKTEST (11/1/16 – 7/7/17) SPREAD 2.8 IG MARKETS
av3 = average[49](close)
TGL = 29
TGS = 20
set target pprofit 52//n*averagetruerange[14]set stop ploss 192//m*averagetruerange[14]
Very good code THANK YOU Francesco78 😉
George,
You can post the full code with your optimization. Thank you
mik
Of course, it’s an optimization over the Kenneth Kvistad optimization :
//CRUDO EE.UU. MINI 1€ (TF-10Min)
//BACKTEST (11/1/16 – 7/7/17) SPREAD 2.8 IG MARKETS
//CAPITAL INICIAL 1000 – 2 CONTRATOS – MAX.DD. 622€ 2 Consecutivas
defparam cumulateorders = false
av1 = average[3](close)av2 = average[20](close)av3 = average[49](close)x = 0.5bull = close> av1 and close >av2 and close > av3bear = close <av1 and close <av2 and close <av3
hammerup = min(open[1],close[1])>high[1]-(high[1]-low[1])/3 //and timeokhammerupnegated= max(open,close)<min(open[1],close[1]) and abs(open-close)/(high-low)>xcs = hammerup and hammerupnegated and bearhammerdown = max(open[1],close[1])<low[1]+(high[1]-low[1])/3 //and timeokhammerdownnegated = min(open,close)>max(open[1],close[1]) and abs(open-close)/(high-low)>xcl = hammerdown and hammerdownnegated and bull
if cs thensellshort 2 contract at marketendif
if cl thenbuy 2 contract at marketendif//<a href=”https://www.prorealcode.com/blog/learning/kinds-trailing-stop-proorder/” target=”_blank”>TRAILING STOP</a>TGL = 29TGS = 20if not onmarket thenMAXPRICE = 0MINPRICE = closePREZZOUSCITA = 0ENDIFif longonmarket thenMAXPRICE = MAX(MAXPRICE,close)if MAXPRICE-tradeprice(1)>=TGL*pointsize thenPREZZOUSCITA = MAXPRICE-TGL*pointsizeENDIFENDIFif shortonmarket thenMINPRICE = MIN(MINPRICE,close)if tradeprice(1)-MINPRICE>=TGS*pointsize thenPREZZOUSCITA = MINPRICE+TGS*pointsizeENDIFENDIFif onmarket and PREZZOUSCITA>0 thenEXITSHORT AT PREZZOUSCITA STOPSELL AT PREZZOUSCITA STOPENDIF
set target pprofit 52set stop ploss 192
I’m novel in ProRealCode and i’m not sure that my optimization es better, someone with more experiencie could value that optimization… Best regards : )
Francesco thank you so much for sharing. You’ve been very busy lately on your very good Strategies!
Be useful to open a Forum post with same Title as this Library post then we can add and compare our results?
CheersGraHal
tnks George.
I have opened a forum thread as suggested by Grahal in order to make discussion more confortable.
https://www.prorealcode.com/topic/oil-10min-hammernegated-pattern-strategy/
Thanks
Hola Francesco,
Muy buenos resultados. No obstante, cuando pongo el código a funcionar, al cabo de un tiempo me aparece el siguiente mensaje: “El sistema de trading se interrumpió, porque ocurrió una división por cero durante la evaluación de la última vela. Le sugerimos que intente añadir protecciones a su código para evitar divisiones por cero, luego backtestear el sistema modificado para comprobar la corrección”.
Good morning at all … first of all congratulations to Francesco for the strategy and everyone for the work you do, I wanted to ask if you have solved the division problem by zero since the system still hangs … some of you know me What do you have to do? Thank you all…
hi Maxgomma and thank youm pls have a look to the forum https://www.prorealcode.com/topic/oil-10min-hammernegated-pattern-strategy/page/3/ the problem of division by zero is tackled and solved there.
Can I know how many trades this strategy make?
I am sorry but I don’t speak English very well.
@francesco,
i see you create a lot of strategy, thanks for your share.
you test it all in live?
for you what is the best?
thanks a lot
Hi rejo007, thank you, yes I have all of them live and manymore that I dont share. one of my favourite is the ncandle and reversion for usdjpy. Regards
@francesco
Thanks a lot, I’ll take a look a this.
Do you have strategy that you can share in private?
If yes, we could discuss at this adress
marbrerievdb@gmail.com
Thanks for your reply 🙂
This was a rather interesting idea that appears to work on a short timeframe. And also interesting to know that you are running these strategies live. Will definitely take a look at this. Thanks for sharing!
Thank you Francesco78 !
What happened after August 21?