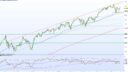
RealMotion indicator as explained by Market Gauge “The brown dots are a dot plot of the individual values of the RealMotion variable. Essentially, they divide the equity price by the moving average of that price (here 200 period). We then … Continue reading Real Motion Indicator
Copy and paste this URL into your WordPress site to embed
Copy and paste this code into your site to embed