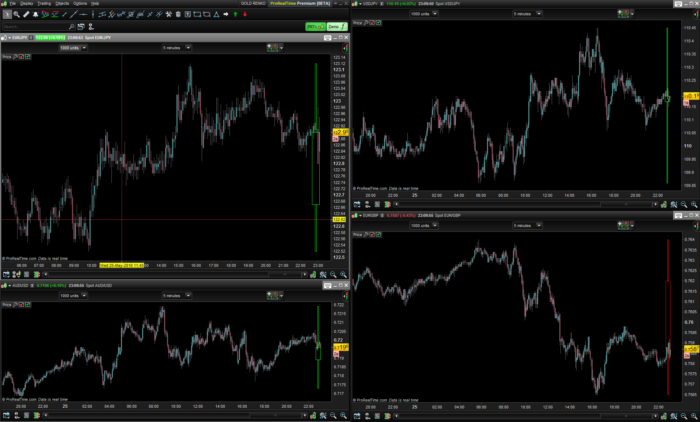
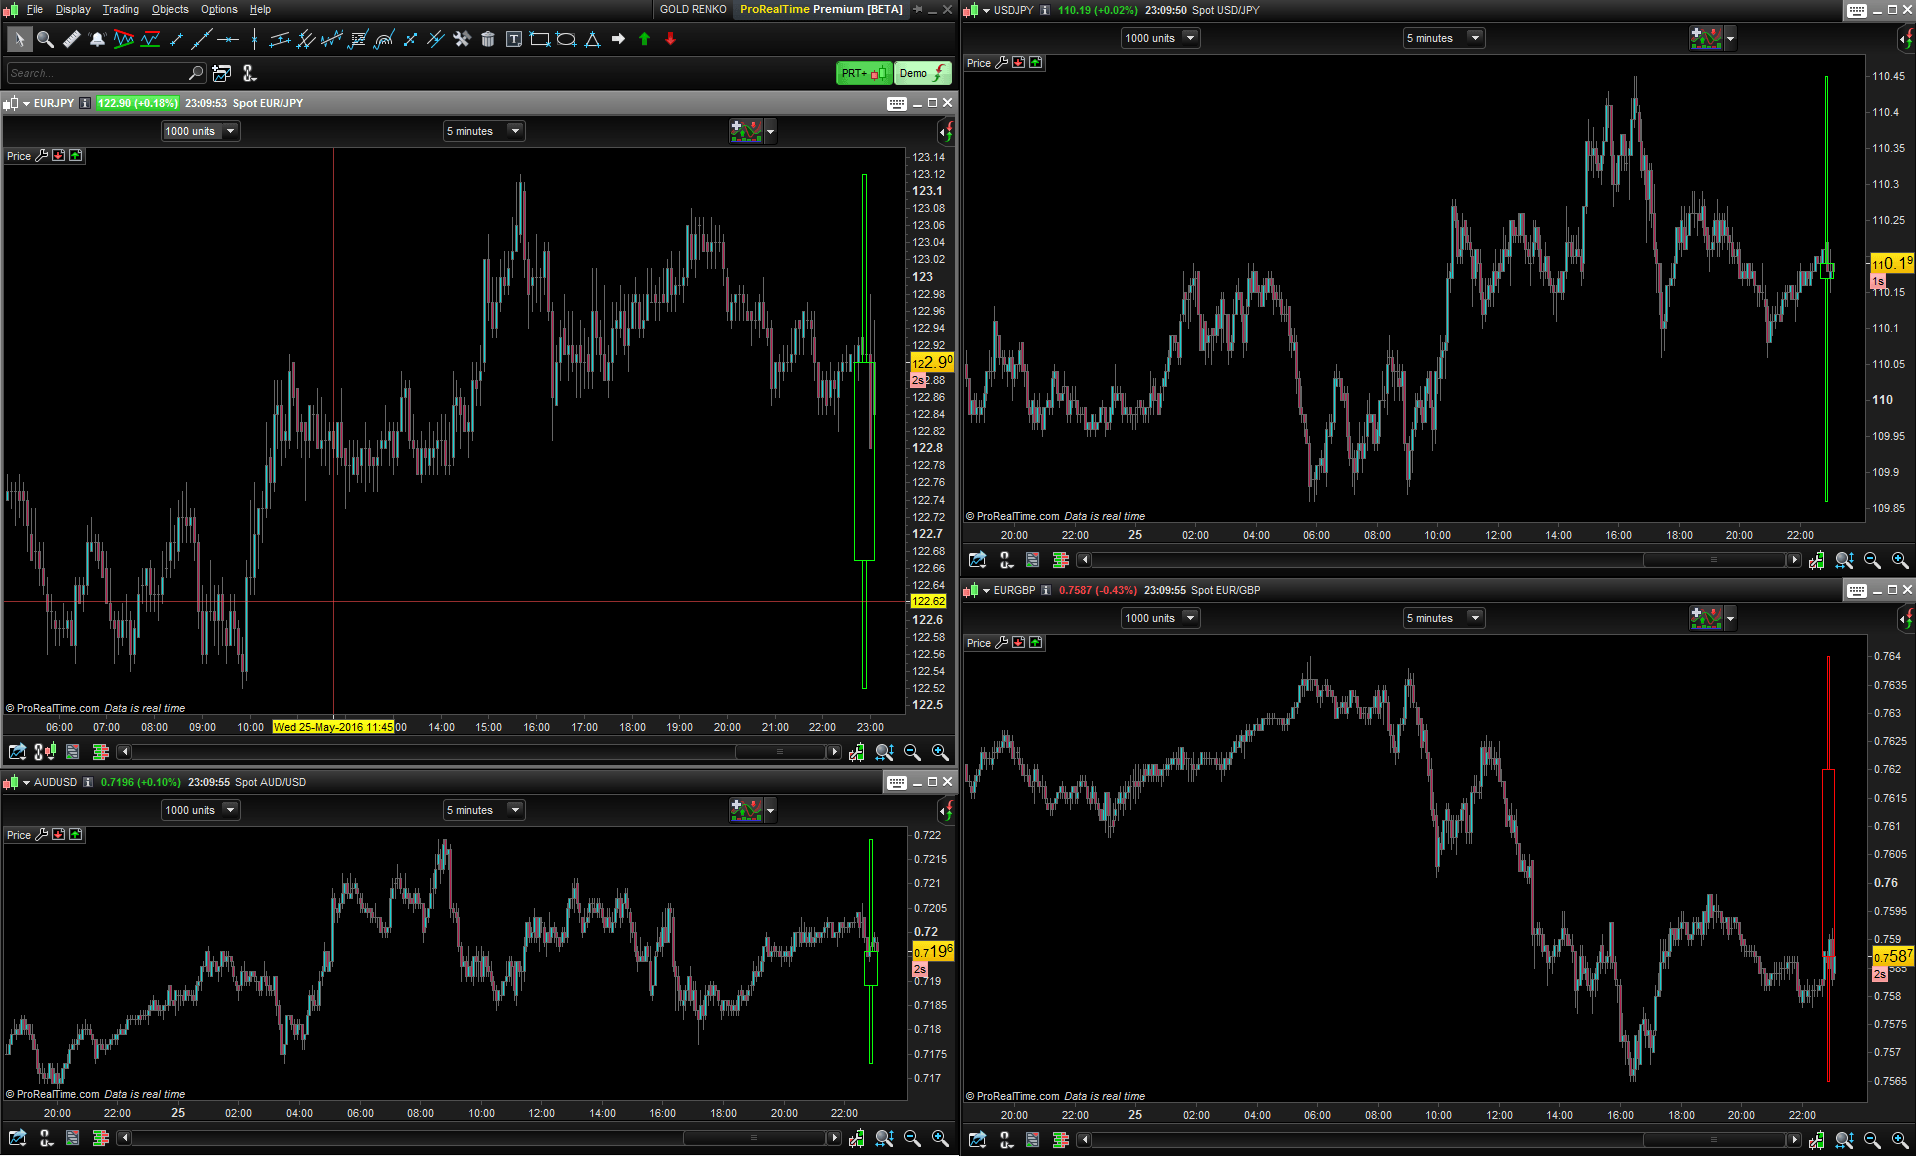
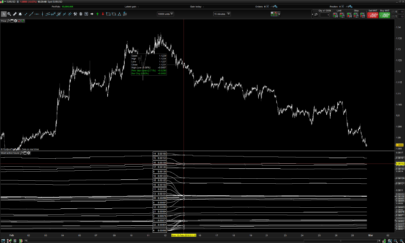
This indicator draw the actual daily candlestick on any timeframe. You can change the visibility of the candlestick with the “alpha” variable set from 0 to 255 which change the transparency of it. It is not possible to draw objects on the right of the chart, so the candle is displayed overlayed of the price.
The candlestick is made of rectangles drawn with the new graphical objects of the 10.3 version of the platform.
|
1 2 3 4 5 6 7 8 9 10 11 12 13 14 15 16 17 18 19 20 21 22 23 24 25 26 27 28 29 30 31 32 33 34 35 |
defparam drawonlastbaronly = true alpha = 255 //from 0 to 255 to change alpha transparency dop = dopen(0) dhi = dhigh(0) dlo = dlow(0) dcl = dclose(0) //candlestick color if dop>dcl then direction = -1 else direction = 1 endif //bullish candle if direction = 1 then //candlestick body DRAWRECTANGLE(barindex-5,dop,barindex,dcl) COLOURED(10,255,10,alpha) //candlestick high and low DRAWRECTANGLE(barindex-3,dcl,barindex-2,dhi) COLOURED(10,255,10,alpha) DRAWRECTANGLE(barindex-3,dop,barindex-2,dlo) COLOURED(10,255,10,alpha) endif //bearish candle if direction = -1 then //candlestick body DRAWRECTANGLE(barindex-5,dcl,barindex,dop) COLOURED(255,10,10,alpha) //candlestick high and low DRAWRECTANGLE(barindex-3,dop,barindex-2,dhi) COLOURED(255,10,10,alpha) DRAWRECTANGLE(barindex-3,dcl,barindex-2,dlo) COLOURED(255,10,10,alpha) endif RETURN |
Share this
No information on this site is investment advice or a solicitation to buy or sell any financial instrument. Past performance is not indicative of future results. Trading may expose you to risk of loss greater than your deposits and is only suitable for experienced investors who have sufficient financial means to bear such risk.
ProRealTime ITF files and other attachments :
Find other exclusive trading pro-tools on ![]()
PRC is also on YouTube, subscribe to our channel for exclusive content and tutorials


Bonjour Nicolas
J’ai mis alpha en variable pour jouer sur la transparence car je ne vois pas comment on peut faire? pour autant la transparence ne bouge pas entre 0 et 255 ! j’ai loupé quelque chose ?
merci
bonne journée à tous
désolé , j’ai compris ! alpha dans le code ou en variable !!
This is the code changed to draw the last 2 days:
defparam drawonlastbaronly = true
alpha = 255 //from 0 to 255 to change alpha transparency
dop = dopen(0)
dhi = dhigh(0)
dlo = dlow(0)
dcl = dclose(0)
//Candle yesterday
dopy = dopen(1)
dhiy = dhigh(1)
dloy = dlow(1)
dcly = dclose(1)
//candlestick color
if dop>dcl then
direction = -1
else
direction = 1
endif
if dopy>dcly then
directiony = -1
else
directiony = 1
endif
//bullish candle
if direction = 1 then
//candlestick body
DRAWRECTANGLE(barindex-7,dop,barindex-2,dcl) COLOURED(10,205,10,alpha)//Originalmente verde 10,255,10
//candlestick high and low
DRAWRECTANGLE(barindex-5,dcl,barindex-4,dhi) COLOURED(10,205,10,alpha)
DRAWRECTANGLE(barindex-5,dop,barindex-4,dlo) COLOURED(10,205,10,alpha)
endif
//bearish candle
if direction = -1 then
//candlestick body
DRAWRECTANGLE(barindex-7,dcl,barindex-2,dop) COLOURED(255,10,10,alpha)
//candlestick high and low
DRAWRECTANGLE(barindex-5,dop,barindex-4,dhi) COLOURED(255,10,10,alpha)
DRAWRECTANGLE(barindex-5,dcl,barindex-4,dlo) COLOURED(255,10,10,alpha)
endif
//bullish candle yesterday
if directiony = 1 then
//candlestick body
DRAWRECTANGLE(barindex-15,dopy,barindex-10,dcly) COLOURED(10,205,10,alpha)
//candlestick high and low
DRAWRECTANGLE(barindex-13,dcly,barindex-12,dhiy) COLOURED(10,205,10,alpha)
DRAWRECTANGLE(barindex-13,dopy,barindex-12,dloy) COLOURED(10,205,10,alpha)
endif
//bearish candle yesterday
if directiony = -1 then
//candlestick body
DRAWRECTANGLE(barindex-15,dcly,barindex-10,dopy) COLOURED(255,10,10,alpha)
//candlestick high and low
DRAWRECTANGLE(barindex-13,dopy,barindex-12,dhiy) COLOURED(255,10,10,alpha)
DRAWRECTANGLE(barindex-13,dcly,barindex-12,dloy) COLOURED(255,10,10,alpha)
endif
RETURN
Thank you Pere!
Hola Nicolas.
¿Existe la posibilidad de que este indicador se muestre también en el histórico anterior ?
That would be possible to be coded using MTF indicator in PRT v11.